Ghanaian vs French American Indian Householder Income Ages 25 - 44 years
COMPARE
Ghanaian
French American Indian
Householder Income Ages 25 - 44 years
Householder Income Ages 25 - 44 years Comparison
Ghanaians
French American Indians
$90,137
HOUSEHOLDER INCOME AGES 25 - 44 YEARS
7.9/ 100
METRIC RATING
216th/ 347
METRIC RANK
$85,899
HOUSEHOLDER INCOME AGES 25 - 44 YEARS
0.8/ 100
METRIC RATING
249th/ 347
METRIC RANK
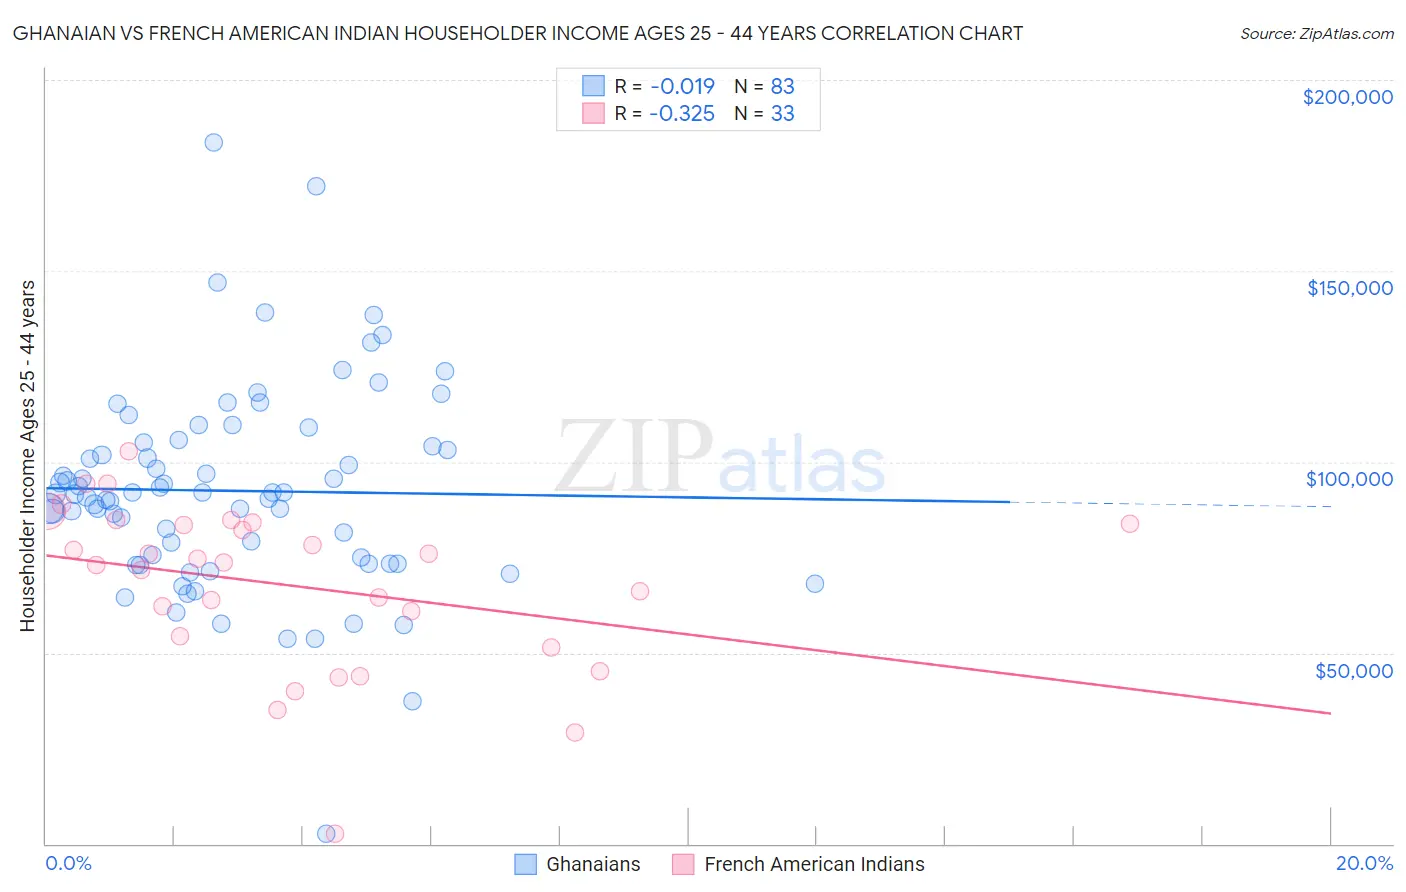
Ghanaian vs French American Indian Householder Income Ages 25 - 44 years Correlation Chart
The statistical analysis conducted on geographies consisting of 190,400,180 people shows no correlation between the proportion of Ghanaians and household income with householder between the ages 25 and 44 in the United States with a correlation coefficient (R) of -0.019 and weighted average of $90,137. Similarly, the statistical analysis conducted on geographies consisting of 131,864,542 people shows a mild negative correlation between the proportion of French American Indians and household income with householder between the ages 25 and 44 in the United States with a correlation coefficient (R) of -0.325 and weighted average of $85,899, a difference of 4.9%.
Householder Income Ages 25 - 44 years Correlation Summary
| Measurement | Ghanaian | French American Indian |
| Minimum | $2,499 | $2,499 |
| Maximum | $183,644 | $102,898 |
| Range | $181,145 | $100,399 |
| Mean | $92,427 | $67,668 |
| Median | $91,588 | $73,750 |
| Interquartile 25% (IQ1) | $73,476 | $52,805 |
| Interquartile 75% (IQ3) | $104,966 | $84,046 |
| Interquartile Range (IQR) | $31,489 | $31,241 |
| Standard Deviation (Sample) | $27,016 | $21,873 |
| Standard Deviation (Population) | $26,853 | $21,539 |
Similar Demographics by Householder Income Ages 25 - 44 years
Demographics Similar to Ghanaians by Householder Income Ages 25 - 44 years
In terms of householder income ages 25 - 44 years, the demographic groups most similar to Ghanaians are Panamanian ($90,193, a difference of 0.060%), Scotch-Irish ($89,969, a difference of 0.19%), Guyanese ($89,940, a difference of 0.22%), Immigrants from Africa ($90,372, a difference of 0.26%), and Delaware ($89,876, a difference of 0.29%).
| Demographics | Rating | Rank | Householder Income Ages 25 - 44 years |
| Immigrants | Uruguay | 13.2 /100 | #209 | Poor $91,171 |
| Immigrants | Kenya | 10.9 /100 | #210 | Poor $90,767 |
| Iraqis | 10.8 /100 | #211 | Poor $90,764 |
| Hawaiians | 10.6 /100 | #212 | Poor $90,722 |
| Immigrants | Bangladesh | 9.3 /100 | #213 | Tragic $90,448 |
| Immigrants | Africa | 8.9 /100 | #214 | Tragic $90,372 |
| Panamanians | 8.1 /100 | #215 | Tragic $90,193 |
| Ghanaians | 7.9 /100 | #216 | Tragic $90,137 |
| Scotch-Irish | 7.3 /100 | #217 | Tragic $89,969 |
| Guyanese | 7.1 /100 | #218 | Tragic $89,940 |
| Delaware | 6.9 /100 | #219 | Tragic $89,876 |
| Trinidadians and Tobagonians | 6.8 /100 | #220 | Tragic $89,856 |
| Immigrants | Trinidad and Tobago | 6.5 /100 | #221 | Tragic $89,748 |
| Immigrants | Ecuador | 6.2 /100 | #222 | Tragic $89,673 |
| Immigrants | Guyana | 5.9 /100 | #223 | Tragic $89,586 |
Demographics Similar to French American Indians by Householder Income Ages 25 - 44 years
In terms of householder income ages 25 - 44 years, the demographic groups most similar to French American Indians are Pennsylvania German ($85,836, a difference of 0.070%), Cape Verdean ($85,758, a difference of 0.16%), Immigrants from Sudan ($86,109, a difference of 0.24%), Immigrants from Western Africa ($85,676, a difference of 0.26%), and British West Indian ($85,565, a difference of 0.39%).
| Demographics | Rating | Rank | Householder Income Ages 25 - 44 years |
| West Indians | 1.7 /100 | #242 | Tragic $87,205 |
| Immigrants | West Indies | 1.5 /100 | #243 | Tragic $87,063 |
| Immigrants | Venezuela | 1.5 /100 | #244 | Tragic $87,038 |
| Immigrants | El Salvador | 1.4 /100 | #245 | Tragic $86,913 |
| Immigrants | Burma/Myanmar | 1.3 /100 | #246 | Tragic $86,736 |
| Immigrants | Nigeria | 1.2 /100 | #247 | Tragic $86,589 |
| Immigrants | Sudan | 0.9 /100 | #248 | Tragic $86,109 |
| French American Indians | 0.8 /100 | #249 | Tragic $85,899 |
| Pennsylvania Germans | 0.8 /100 | #250 | Tragic $85,836 |
| Cape Verdeans | 0.8 /100 | #251 | Tragic $85,758 |
| Immigrants | Western Africa | 0.7 /100 | #252 | Tragic $85,676 |
| British West Indians | 0.7 /100 | #253 | Tragic $85,565 |
| Immigrants | Laos | 0.7 /100 | #254 | Tragic $85,553 |
| German Russians | 0.6 /100 | #255 | Tragic $85,220 |
| Central Americans | 0.5 /100 | #256 | Tragic $85,144 |