Immigrants from Dominican Republic vs French American Indian Householder Income Ages 25 - 44 years
COMPARE
Immigrants from Dominican Republic
French American Indian
Householder Income Ages 25 - 44 years
Householder Income Ages 25 - 44 years Comparison
Immigrants from Dominican Republic
French American Indians
$80,319
HOUSEHOLDER INCOME AGES 25 - 44 YEARS
0.0/ 100
METRIC RATING
305th/ 347
METRIC RANK
$85,899
HOUSEHOLDER INCOME AGES 25 - 44 YEARS
0.8/ 100
METRIC RATING
249th/ 347
METRIC RANK
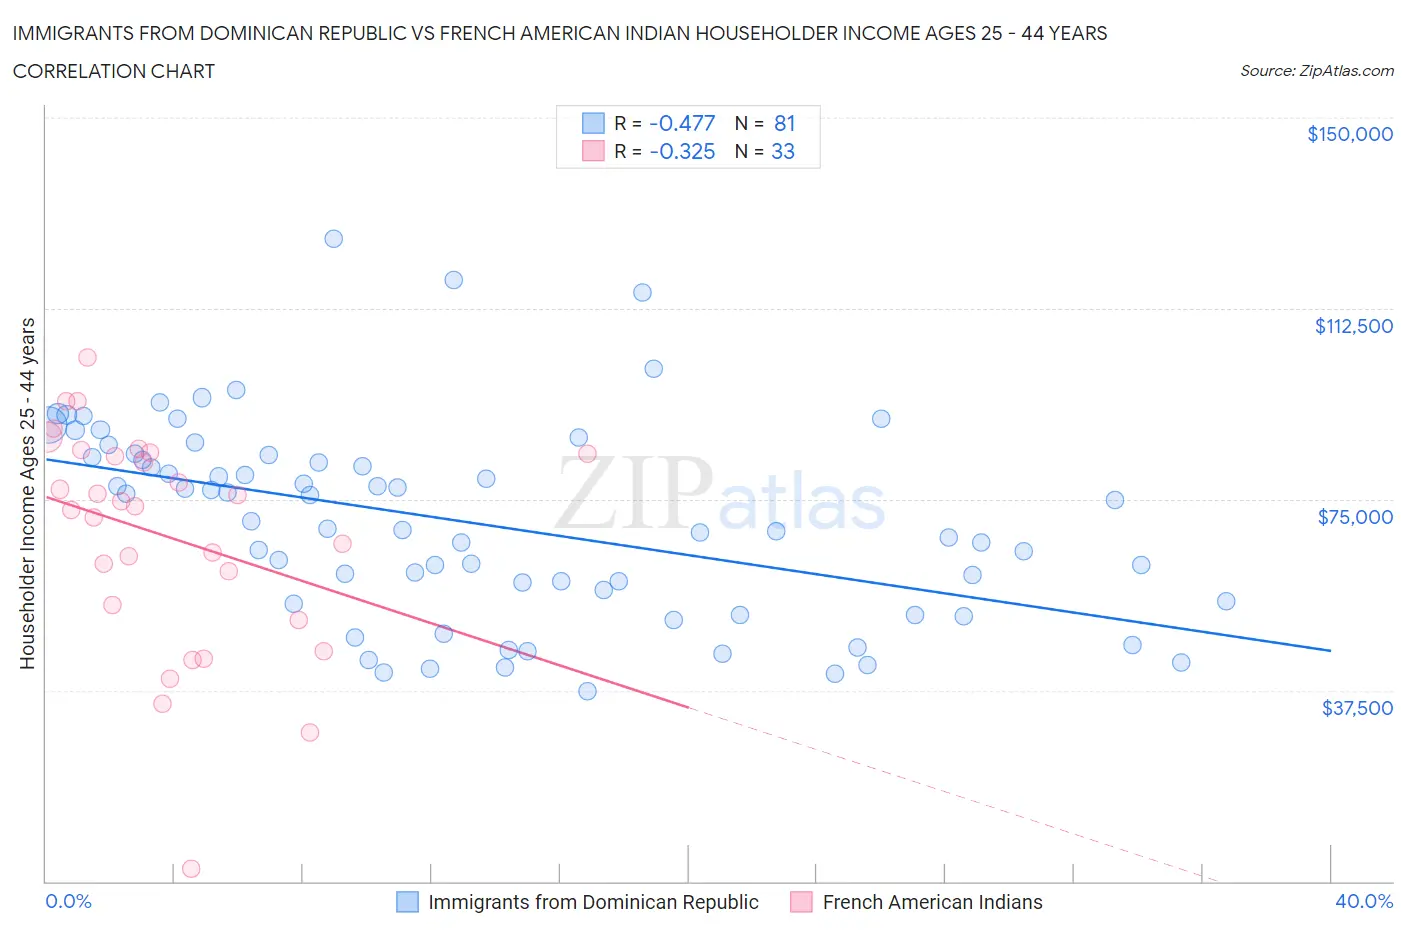
Immigrants from Dominican Republic vs French American Indian Householder Income Ages 25 - 44 years Correlation Chart
The statistical analysis conducted on geographies consisting of 274,672,798 people shows a moderate negative correlation between the proportion of Immigrants from Dominican Republic and household income with householder between the ages 25 and 44 in the United States with a correlation coefficient (R) of -0.477 and weighted average of $80,319. Similarly, the statistical analysis conducted on geographies consisting of 131,864,542 people shows a mild negative correlation between the proportion of French American Indians and household income with householder between the ages 25 and 44 in the United States with a correlation coefficient (R) of -0.325 and weighted average of $85,899, a difference of 7.0%.
Householder Income Ages 25 - 44 years Correlation Summary
| Measurement | Immigrants from Dominican Republic | French American Indian |
| Minimum | $37,215 | $2,499 |
| Maximum | $126,257 | $102,898 |
| Range | $89,042 | $100,399 |
| Mean | $70,454 | $67,668 |
| Median | $69,254 | $73,750 |
| Interquartile 25% (IQ1) | $54,727 | $52,805 |
| Interquartile 75% (IQ3) | $83,452 | $84,046 |
| Interquartile Range (IQR) | $28,725 | $31,241 |
| Standard Deviation (Sample) | $19,333 | $21,873 |
| Standard Deviation (Population) | $19,213 | $21,539 |
Similar Demographics by Householder Income Ages 25 - 44 years
Demographics Similar to Immigrants from Dominican Republic by Householder Income Ages 25 - 44 years
In terms of householder income ages 25 - 44 years, the demographic groups most similar to Immigrants from Dominican Republic are Immigrants from Caribbean ($80,326, a difference of 0.010%), Apache ($80,260, a difference of 0.070%), Mexican ($80,427, a difference of 0.13%), Hispanic or Latino ($80,515, a difference of 0.24%), and Immigrants from Micronesia ($80,544, a difference of 0.28%).
| Demographics | Rating | Rank | Householder Income Ages 25 - 44 years |
| Dominicans | 0.1 /100 | #298 | Tragic $81,229 |
| Immigrants | Liberia | 0.1 /100 | #299 | Tragic $80,863 |
| Cherokee | 0.0 /100 | #300 | Tragic $80,843 |
| Immigrants | Micronesia | 0.0 /100 | #301 | Tragic $80,544 |
| Hispanics or Latinos | 0.0 /100 | #302 | Tragic $80,515 |
| Mexicans | 0.0 /100 | #303 | Tragic $80,427 |
| Immigrants | Caribbean | 0.0 /100 | #304 | Tragic $80,326 |
| Immigrants | Dominican Republic | 0.0 /100 | #305 | Tragic $80,319 |
| Apache | 0.0 /100 | #306 | Tragic $80,260 |
| Haitians | 0.0 /100 | #307 | Tragic $80,055 |
| Immigrants | Central America | 0.0 /100 | #308 | Tragic $80,012 |
| Chippewa | 0.0 /100 | #309 | Tragic $80,005 |
| Fijians | 0.0 /100 | #310 | Tragic $79,956 |
| Indonesians | 0.0 /100 | #311 | Tragic $79,543 |
| Immigrants | Haiti | 0.0 /100 | #312 | Tragic $79,391 |
Demographics Similar to French American Indians by Householder Income Ages 25 - 44 years
In terms of householder income ages 25 - 44 years, the demographic groups most similar to French American Indians are Pennsylvania German ($85,836, a difference of 0.070%), Cape Verdean ($85,758, a difference of 0.16%), Immigrants from Sudan ($86,109, a difference of 0.24%), Immigrants from Western Africa ($85,676, a difference of 0.26%), and British West Indian ($85,565, a difference of 0.39%).
| Demographics | Rating | Rank | Householder Income Ages 25 - 44 years |
| West Indians | 1.7 /100 | #242 | Tragic $87,205 |
| Immigrants | West Indies | 1.5 /100 | #243 | Tragic $87,063 |
| Immigrants | Venezuela | 1.5 /100 | #244 | Tragic $87,038 |
| Immigrants | El Salvador | 1.4 /100 | #245 | Tragic $86,913 |
| Immigrants | Burma/Myanmar | 1.3 /100 | #246 | Tragic $86,736 |
| Immigrants | Nigeria | 1.2 /100 | #247 | Tragic $86,589 |
| Immigrants | Sudan | 0.9 /100 | #248 | Tragic $86,109 |
| French American Indians | 0.8 /100 | #249 | Tragic $85,899 |
| Pennsylvania Germans | 0.8 /100 | #250 | Tragic $85,836 |
| Cape Verdeans | 0.8 /100 | #251 | Tragic $85,758 |
| Immigrants | Western Africa | 0.7 /100 | #252 | Tragic $85,676 |
| British West Indians | 0.7 /100 | #253 | Tragic $85,565 |
| Immigrants | Laos | 0.7 /100 | #254 | Tragic $85,553 |
| German Russians | 0.6 /100 | #255 | Tragic $85,220 |
| Central Americans | 0.5 /100 | #256 | Tragic $85,144 |