Polish vs Asian Median Family Income
COMPARE
Polish
Asian
Median Family Income
Median Family Income Comparison
Poles
Asians
$108,507
MEDIAN FAMILY INCOME
95.2/ 100
METRIC RATING
114th/ 347
METRIC RANK
$119,955
MEDIAN FAMILY INCOME
100.0/ 100
METRIC RATING
32nd/ 347
METRIC RANK
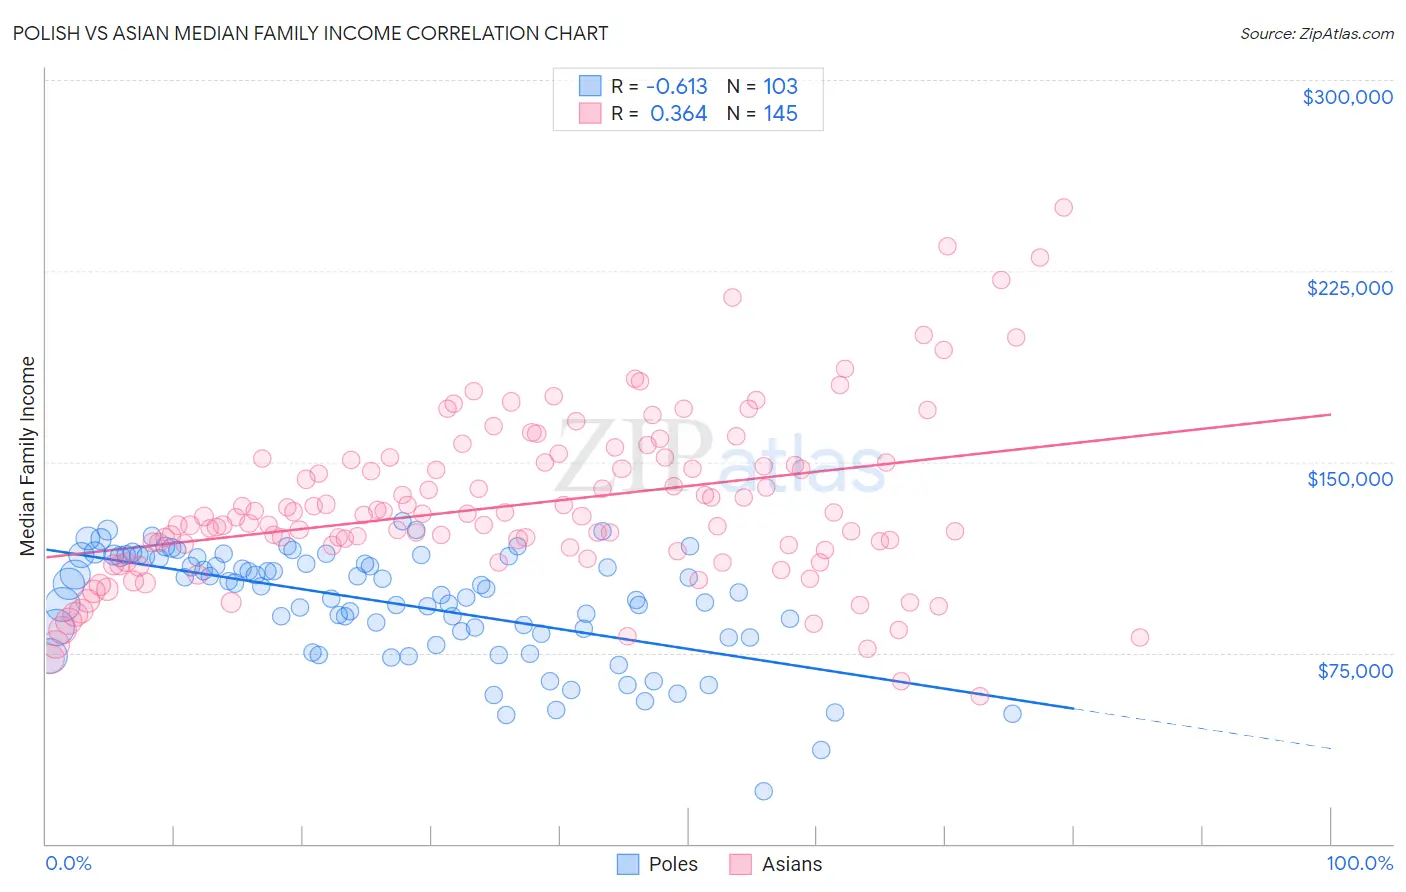
Polish vs Asian Median Family Income Correlation Chart
The statistical analysis conducted on geographies consisting of 559,354,572 people shows a significant negative correlation between the proportion of Poles and median family income in the United States with a correlation coefficient (R) of -0.613 and weighted average of $108,507. Similarly, the statistical analysis conducted on geographies consisting of 549,758,807 people shows a mild positive correlation between the proportion of Asians and median family income in the United States with a correlation coefficient (R) of 0.364 and weighted average of $119,955, a difference of 10.5%.
Median Family Income Correlation Summary
| Measurement | Polish | Asian |
| Minimum | $20,484 | $58,163 |
| Maximum | $126,779 | $250,001 |
| Range | $106,295 | $191,838 |
| Mean | $94,533 | $133,077 |
| Median | $100,344 | $128,500 |
| Interquartile 25% (IQ1) | $82,684 | $115,250 |
| Interquartile 75% (IQ3) | $112,830 | $150,323 |
| Interquartile Range (IQR) | $30,146 | $35,073 |
| Standard Deviation (Sample) | $21,570 | $33,384 |
| Standard Deviation (Population) | $21,465 | $33,269 |
Similar Demographics by Median Family Income
Demographics Similar to Poles by Median Family Income
In terms of median family income, the demographic groups most similar to Poles are Swedish ($108,499, a difference of 0.010%), Immigrants from Saudi Arabia ($108,544, a difference of 0.030%), Immigrants from Poland ($108,570, a difference of 0.060%), Chilean ($108,429, a difference of 0.070%), and Immigrants from Western Asia ($108,691, a difference of 0.17%).
| Demographics | Rating | Rank | Median Family Income |
| Immigrants | North Macedonia | 96.4 /100 | #107 | Exceptional $109,136 |
| Immigrants | Zimbabwe | 95.9 /100 | #108 | Exceptional $108,830 |
| Immigrants | Afghanistan | 95.6 /100 | #109 | Exceptional $108,709 |
| British | 95.6 /100 | #110 | Exceptional $108,705 |
| Immigrants | Western Asia | 95.6 /100 | #111 | Exceptional $108,691 |
| Immigrants | Poland | 95.3 /100 | #112 | Exceptional $108,570 |
| Immigrants | Saudi Arabia | 95.2 /100 | #113 | Exceptional $108,544 |
| Poles | 95.2 /100 | #114 | Exceptional $108,507 |
| Swedes | 95.1 /100 | #115 | Exceptional $108,499 |
| Chileans | 95.0 /100 | #116 | Exceptional $108,429 |
| Immigrants | Philippines | 94.6 /100 | #117 | Exceptional $108,288 |
| Ethiopians | 94.5 /100 | #118 | Exceptional $108,251 |
| Sri Lankans | 94.5 /100 | #119 | Exceptional $108,234 |
| Immigrants | Northern Africa | 94.3 /100 | #120 | Exceptional $108,161 |
| Europeans | 94.1 /100 | #121 | Exceptional $108,099 |
Demographics Similar to Asians by Median Family Income
In terms of median family income, the demographic groups most similar to Asians are Immigrants from France ($120,076, a difference of 0.10%), Bhutanese ($119,800, a difference of 0.13%), Immigrants from Sri Lanka ($120,263, a difference of 0.26%), Latvian ($120,301, a difference of 0.29%), and Bolivian ($119,479, a difference of 0.40%).
| Demographics | Rating | Rank | Median Family Income |
| Turks | 100.0 /100 | #25 | Exceptional $121,202 |
| Immigrants | Switzerland | 100.0 /100 | #26 | Exceptional $120,726 |
| Russians | 100.0 /100 | #27 | Exceptional $120,487 |
| Immigrants | Denmark | 100.0 /100 | #28 | Exceptional $120,445 |
| Latvians | 100.0 /100 | #29 | Exceptional $120,301 |
| Immigrants | Sri Lanka | 100.0 /100 | #30 | Exceptional $120,263 |
| Immigrants | France | 100.0 /100 | #31 | Exceptional $120,076 |
| Asians | 100.0 /100 | #32 | Exceptional $119,955 |
| Bhutanese | 100.0 /100 | #33 | Exceptional $119,800 |
| Bolivians | 100.0 /100 | #34 | Exceptional $119,479 |
| Soviet Union | 100.0 /100 | #35 | Exceptional $119,262 |
| Israelis | 100.0 /100 | #36 | Exceptional $118,577 |
| Australians | 100.0 /100 | #37 | Exceptional $118,440 |
| Immigrants | Turkey | 100.0 /100 | #38 | Exceptional $118,325 |
| Immigrants | Asia | 100.0 /100 | #39 | Exceptional $118,291 |