Pennsylvania German vs Immigrants from Armenia Householder Income Ages 45 - 64 years
COMPARE
Pennsylvania German
Immigrants from Armenia
Householder Income Ages 45 - 64 years
Householder Income Ages 45 - 64 years Comparison
Pennsylvania Germans
Immigrants from Armenia
$91,956
HOUSEHOLDER INCOME AGES 45 - 64 YEARS
1.5/ 100
METRIC RATING
238th/ 347
METRIC RANK
$94,863
HOUSEHOLDER INCOME AGES 45 - 64 YEARS
6.1/ 100
METRIC RATING
219th/ 347
METRIC RANK
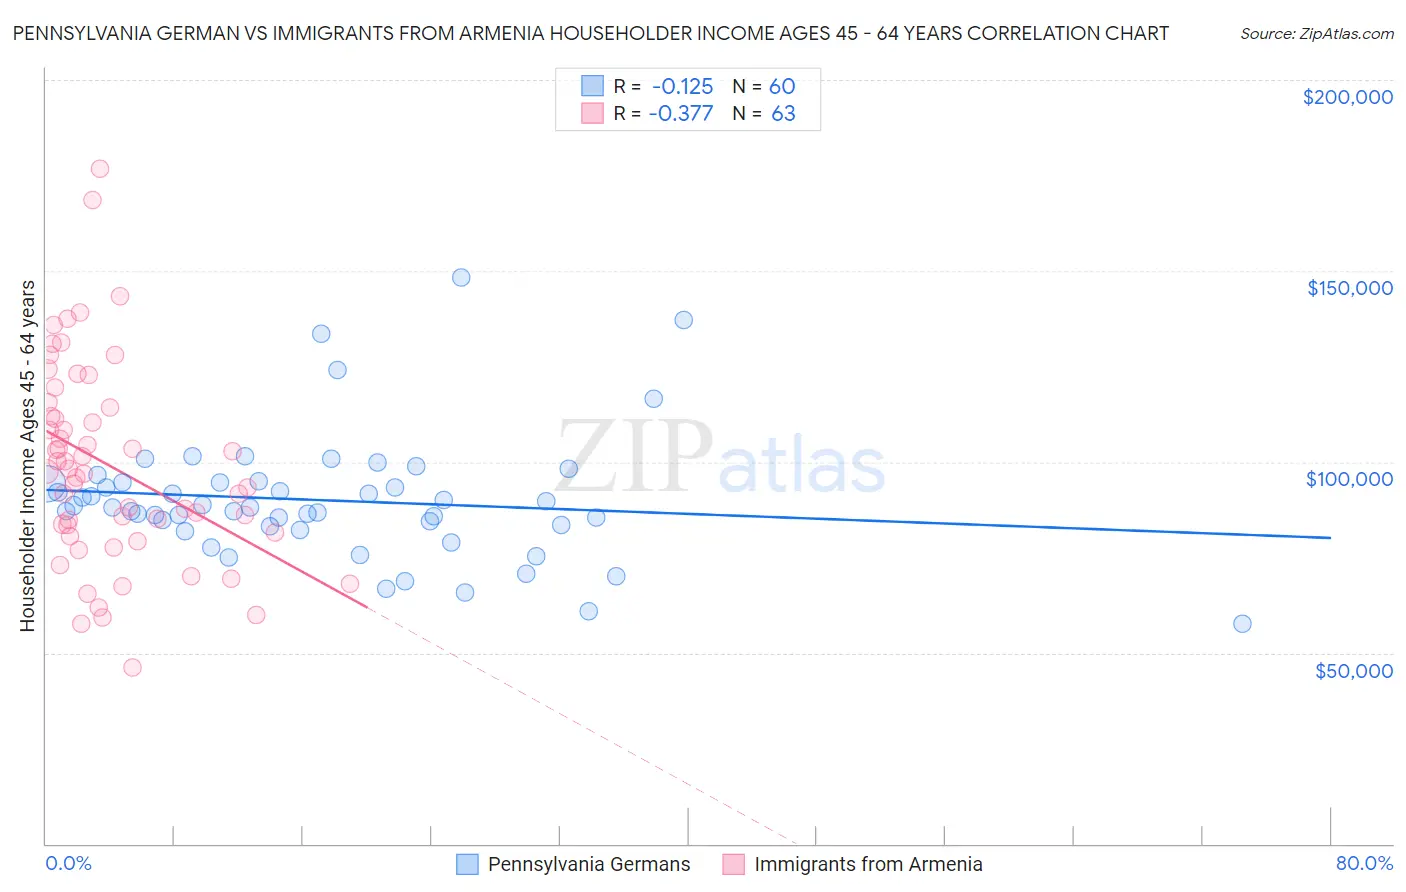
Pennsylvania German vs Immigrants from Armenia Householder Income Ages 45 - 64 years Correlation Chart
The statistical analysis conducted on geographies consisting of 233,806,042 people shows a poor negative correlation between the proportion of Pennsylvania Germans and household income with householder between the ages 45 and 64 in the United States with a correlation coefficient (R) of -0.125 and weighted average of $91,956. Similarly, the statistical analysis conducted on geographies consisting of 97,702,858 people shows a mild negative correlation between the proportion of Immigrants from Armenia and household income with householder between the ages 45 and 64 in the United States with a correlation coefficient (R) of -0.377 and weighted average of $94,863, a difference of 3.2%.
Householder Income Ages 45 - 64 years Correlation Summary
| Measurement | Pennsylvania German | Immigrants from Armenia |
| Minimum | $57,750 | $46,250 |
| Maximum | $148,333 | $176,833 |
| Range | $90,583 | $130,583 |
| Mean | $89,968 | $99,033 |
| Median | $88,175 | $97,613 |
| Interquartile 25% (IQ1) | $83,450 | $81,563 |
| Interquartile 75% (IQ3) | $94,494 | $114,231 |
| Interquartile Range (IQR) | $11,044 | $32,668 |
| Standard Deviation (Sample) | $16,415 | $26,282 |
| Standard Deviation (Population) | $16,277 | $26,073 |
Demographics Similar to Pennsylvania Germans and Immigrants from Armenia by Householder Income Ages 45 - 64 years
In terms of householder income ages 45 - 64 years, the demographic groups most similar to Pennsylvania Germans are Immigrants from Bangladesh ($92,208, a difference of 0.27%), Immigrants from Western Africa ($92,384, a difference of 0.46%), Nicaraguan ($92,554, a difference of 0.65%), Immigrants from El Salvador ($93,176, a difference of 1.3%), and Nepalese ($93,355, a difference of 1.5%). Similarly, the demographic groups most similar to Immigrants from Armenia are Salvadoran ($94,842, a difference of 0.020%), Delaware ($94,914, a difference of 0.050%), Immigrants from Nigeria ($94,804, a difference of 0.060%), Malaysian ($94,517, a difference of 0.37%), and Nonimmigrants ($94,448, a difference of 0.44%).
| Demographics | Rating | Rank | Householder Income Ages 45 - 64 years |
| Delaware | 6.2 /100 | #218 | Tragic $94,914 |
| Immigrants | Armenia | 6.1 /100 | #219 | Tragic $94,863 |
| Salvadorans | 6.0 /100 | #220 | Tragic $94,842 |
| Immigrants | Nigeria | 5.9 /100 | #221 | Tragic $94,804 |
| Malaysians | 5.2 /100 | #222 | Tragic $94,517 |
| Immigrants | Nonimmigrants | 5.0 /100 | #223 | Tragic $94,448 |
| Immigrants | Bosnia and Herzegovina | 4.6 /100 | #224 | Tragic $94,288 |
| Bermudans | 4.4 /100 | #225 | Tragic $94,197 |
| Immigrants | Azores | 4.3 /100 | #226 | Tragic $94,138 |
| Alaska Natives | 4.0 /100 | #227 | Tragic $93,991 |
| Immigrants | Panama | 3.7 /100 | #228 | Tragic $93,815 |
| Vietnamese | 3.6 /100 | #229 | Tragic $93,788 |
| Immigrants | Sudan | 3.6 /100 | #230 | Tragic $93,781 |
| Ecuadorians | 3.6 /100 | #231 | Tragic $93,739 |
| Sudanese | 3.5 /100 | #232 | Tragic $93,718 |
| Nepalese | 3.0 /100 | #233 | Tragic $93,355 |
| Immigrants | El Salvador | 2.7 /100 | #234 | Tragic $93,176 |
| Nicaraguans | 2.0 /100 | #235 | Tragic $92,554 |
| Immigrants | Western Africa | 1.8 /100 | #236 | Tragic $92,384 |
| Immigrants | Bangladesh | 1.7 /100 | #237 | Tragic $92,208 |
| Pennsylvania Germans | 1.5 /100 | #238 | Tragic $91,956 |