Immigrants from Cameroon vs Peruvian Householder Income Over 65 years
COMPARE
Immigrants from Cameroon
Peruvian
Householder Income Over 65 years
Householder Income Over 65 years Comparison
Immigrants from Cameroon
Peruvians
$63,907
HOUSEHOLDER INCOME OVER 65 YEARS
95.6/ 100
METRIC RATING
104th/ 347
METRIC RANK
$62,766
HOUSEHOLDER INCOME OVER 65 YEARS
86.8/ 100
METRIC RATING
126th/ 347
METRIC RANK
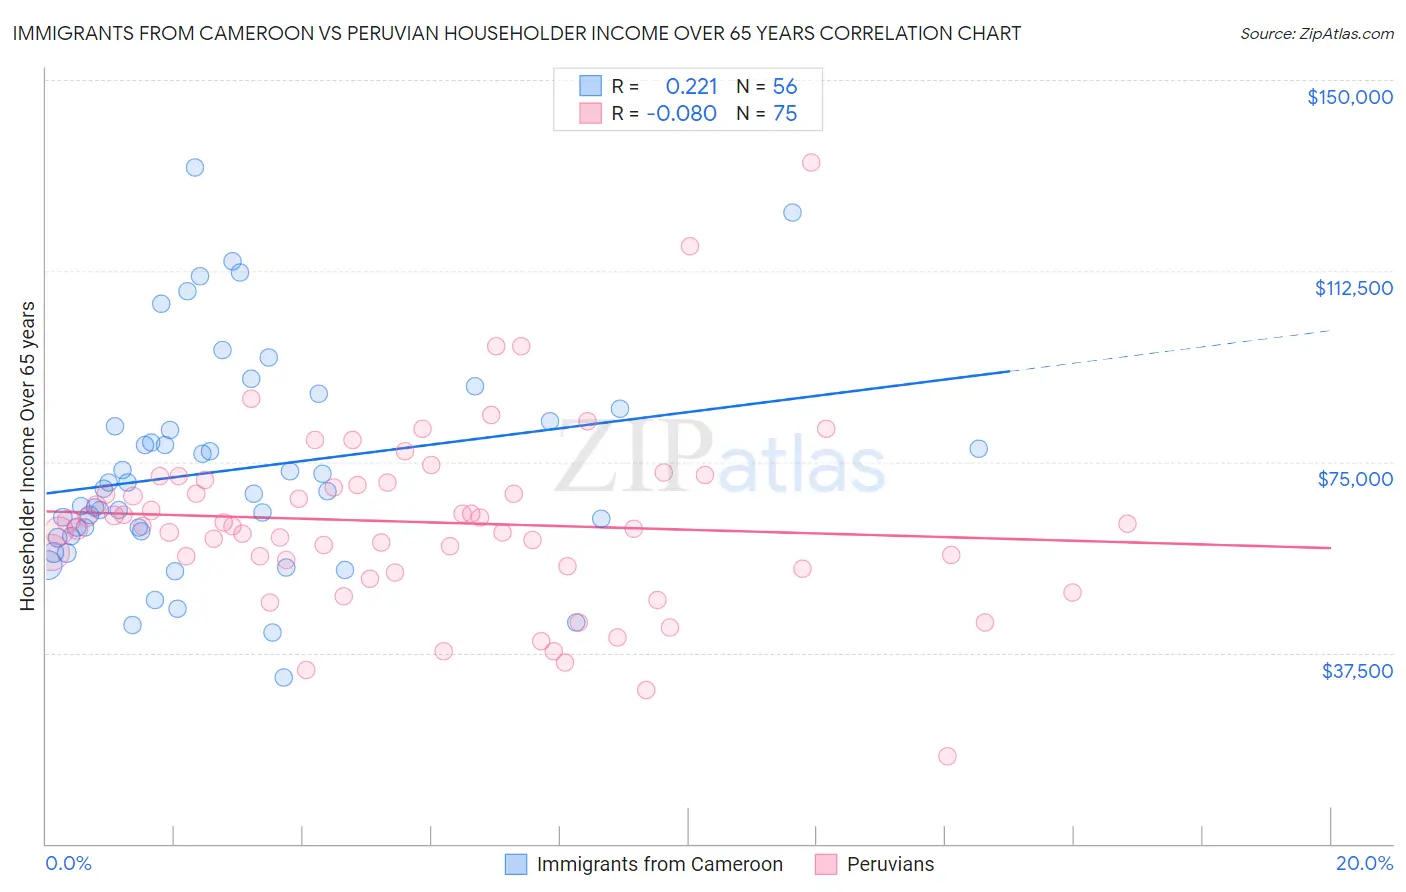
Immigrants from Cameroon vs Peruvian Householder Income Over 65 years Correlation Chart
The statistical analysis conducted on geographies consisting of 130,525,234 people shows a weak positive correlation between the proportion of Immigrants from Cameroon and household income with householder over the age of 65 in the United States with a correlation coefficient (R) of 0.221 and weighted average of $63,907. Similarly, the statistical analysis conducted on geographies consisting of 361,900,663 people shows a slight negative correlation between the proportion of Peruvians and household income with householder over the age of 65 in the United States with a correlation coefficient (R) of -0.080 and weighted average of $62,766, a difference of 1.8%.
Householder Income Over 65 years Correlation Summary
| Measurement | Immigrants from Cameroon | Peruvian |
| Minimum | $32,708 | $17,083 |
| Maximum | $132,857 | $133,750 |
| Range | $100,149 | $116,667 |
| Mean | $73,454 | $63,177 |
| Median | $69,536 | $62,351 |
| Interquartile 25% (IQ1) | $60,820 | $54,608 |
| Interquartile 75% (IQ3) | $82,446 | $70,924 |
| Interquartile Range (IQR) | $21,626 | $16,316 |
| Standard Deviation (Sample) | $21,221 | $17,972 |
| Standard Deviation (Population) | $21,031 | $17,852 |
Similar Demographics by Householder Income Over 65 years
Demographics Similar to Immigrants from Cameroon by Householder Income Over 65 years
In terms of householder income over 65 years, the demographic groups most similar to Immigrants from Cameroon are Italian ($63,885, a difference of 0.030%), Immigrants from Argentina ($63,885, a difference of 0.030%), British ($63,940, a difference of 0.050%), Chilean ($63,957, a difference of 0.080%), and Pakistani ($63,844, a difference of 0.10%).
| Demographics | Rating | Rank | Householder Income Over 65 years |
| Sri Lankans | 96.7 /100 | #97 | Exceptional $64,201 |
| Romanians | 96.5 /100 | #98 | Exceptional $64,142 |
| Assyrians/Chaldeans/Syriacs | 96.4 /100 | #99 | Exceptional $64,108 |
| Immigrants | South Eastern Asia | 96.3 /100 | #100 | Exceptional $64,089 |
| Immigrants | Italy | 96.2 /100 | #101 | Exceptional $64,065 |
| Chileans | 95.8 /100 | #102 | Exceptional $63,957 |
| British | 95.7 /100 | #103 | Exceptional $63,940 |
| Immigrants | Cameroon | 95.6 /100 | #104 | Exceptional $63,907 |
| Italians | 95.5 /100 | #105 | Exceptional $63,885 |
| Immigrants | Argentina | 95.5 /100 | #106 | Exceptional $63,885 |
| Pakistanis | 95.3 /100 | #107 | Exceptional $63,844 |
| Palestinians | 95.1 /100 | #108 | Exceptional $63,800 |
| Europeans | 95.0 /100 | #109 | Exceptional $63,779 |
| Immigrants | Zimbabwe | 94.3 /100 | #110 | Exceptional $63,643 |
| Immigrants | Spain | 93.7 /100 | #111 | Exceptional $63,540 |
Demographics Similar to Peruvians by Householder Income Over 65 years
In terms of householder income over 65 years, the demographic groups most similar to Peruvians are Swedish ($62,736, a difference of 0.050%), Aleut ($62,708, a difference of 0.090%), Immigrants from Eastern Europe ($62,693, a difference of 0.12%), Soviet Union ($62,848, a difference of 0.13%), and Basque ($62,653, a difference of 0.18%).
| Demographics | Rating | Rank | Householder Income Over 65 years |
| Immigrants | Jordan | 89.8 /100 | #119 | Excellent $63,041 |
| Ukrainians | 89.7 /100 | #120 | Excellent $63,032 |
| Immigrants | Vietnam | 89.5 /100 | #121 | Excellent $63,014 |
| Immigrants | Moldova | 88.7 /100 | #122 | Excellent $62,939 |
| Tlingit-Haida | 88.6 /100 | #123 | Excellent $62,922 |
| Taiwanese | 88.3 /100 | #124 | Excellent $62,894 |
| Soviet Union | 87.8 /100 | #125 | Excellent $62,848 |
| Peruvians | 86.8 /100 | #126 | Excellent $62,766 |
| Swedes | 86.4 /100 | #127 | Excellent $62,736 |
| Aleuts | 86.1 /100 | #128 | Excellent $62,708 |
| Immigrants | Eastern Europe | 85.9 /100 | #129 | Excellent $62,693 |
| Basques | 85.4 /100 | #130 | Excellent $62,653 |
| Immigrants | Western Asia | 85.3 /100 | #131 | Excellent $62,645 |
| Immigrants | Germany | 83.9 /100 | #132 | Excellent $62,544 |
| Immigrants | Northern Africa | 83.6 /100 | #133 | Excellent $62,522 |