Russian vs Peruvian Householder Income Over 65 years

COMPARE

Russian
Race
Ancestry
AfghanAfricanAlaska NativeAlaskan AthabascanAlbanianAleutAlsatianAmericanApacheArabArapahoArgentineanArmenianAssyrian/Chaldean/SyriacAustralianAustrianBahamianBangladeshiBarbadianBasqueBelgianBelizeanBermudanBhutaneseBlackfeetBolivianBrazilianBritishBritish West IndianBulgarianBurmeseCajunCambodianCanadianCape VerdeanCarpatho RusynCelticCentral AmericanCentral American IndianCherokeeCheyenneChickasawChileanChineseChippewaChoctawColombianColvilleComancheCosta RicanCreeCreekCroatianCrowCubanCypriotCzechCzechoslovakianDanishDelawareDominicanDutchDutch West IndianEastern EuropeanEcuadorianEgyptianEnglishEstonianEthiopianEuropeanFijianFilipinoFinnishFrenchFrench American IndianFrench CanadianGermanGerman RussianGhanaianGreekGuamanian/ChamorroGuatemalanGuyaneseHaitianHmongHonduranHopiHoumaHungarianIcelanderIndian (Asian)IndonesianInupiatIranianIraqiIrishIroquoisIsraeliItalianJamaicanJapaneseJordanianKenyanKiowaKoreanLaotianLatvianLebaneseLiberianLithuanianLumbeeLuxembourgerMacedonianMalaysianMalteseMarshalleseMenomineeMexicanMexican American IndianMongolianMoroccanNative HawaiianNavajoNepaleseNew ZealanderNicaraguanNigerianNorthern EuropeanNorwegianOkinawanOsageOttawaPaiutePakistaniPalestinianPanamanianParaguayanPennsylvania GermanPimaPolishPortuguesePotawatomiPuebloPuerto RicanPuget Sound SalishRomanianRussianSalvadoranSamoanScandinavianScotch-IrishScottishSeminoleSenegaleseSerbianShoshoneSierra LeoneanSiouxSlavicSlovakSloveneSomaliSouth AfricanSouth AmericanSouth American IndianSoviet UnionSpaniardSpanishSpanish AmericanSpanish American IndianSri LankanSubsaharan AfricanSudaneseSwedishSwissSyrianTaiwaneseThaiTlingit-HaidaTohono O'OdhamTonganTrinidadian and TobagonianTsimshianTurkishU.S. Virgin IslanderUgandanUkrainianUruguayanUteVenezuelanVietnameseWelshWest IndianYakamaYaquiYugoslavianYumanYup'ikZimbabwean
Immigration
NonimmigrantsImmigrantsAfghanistanAfricaAlbaniaArgentinaArmeniaAsiaAustraliaAustriaBahamasBangladeshBarbadosBelarusBelgiumBelizeBoliviaBosnia and HerzegovinaBrazilBulgariaBurma/MyanmarCabo VerdeCambodiaCameroonCanadaCaribbeanCentral AmericaChileChinaColombiaCongoCosta RicaCroatiaCubaCzechoslovakiaDenmarkDominicaDominican RepublicEastern AfricaEastern AsiaEastern EuropeEcuadorEgyptEl SalvadorEnglandEritreaEthiopiaEuropeFijiFranceGermanyGhanaGreeceGrenadaGuatemalaGuyanaHaitiHondurasHong KongHungaryIndiaIndonesiaIranIraqIrelandIsraelItalyJamaicaJapanJordanKazakhstanKenyaKoreaKuwaitLaosLatin AmericaLatviaLebanonLiberiaLithuaniaMalaysiaMexicoMicronesiaMiddle AfricaMoldovaMoroccoNepalNetherlandsNicaraguaNigeriaNorth AmericaNorth MacedoniaNorthern AfricaNorthern EuropeNorwayOceaniaPakistanPanamaPeruPhilippinesPolandPortugalRomaniaRussiaSaudi ArabiaScotlandSenegalSerbiaSierra LeoneSingaporeSomaliaSouth AfricaSouth AmericaSouth Central AsiaSouth Eastern AsiaSouthern EuropeSpainSri LankaSt. Vincent and the GrenadinesSudanSwedenSwitzerlandSyriaTaiwanThailandTrinidad and TobagoTurkeyUgandaUkraineUruguayUzbekistanVenezuelaVietnamWest IndiesWestern AfricaWestern AsiaWestern EuropeYemenZaireZimbabweAzores
Peruvian
Race
Ancestry
AfghanAfricanAlaska NativeAlaskan AthabascanAlbanianAleutAlsatianAmericanApacheArabArapahoArgentineanArmenianAssyrian/Chaldean/SyriacAustralianAustrianBahamianBangladeshiBarbadianBasqueBelgianBelizeanBermudanBhutaneseBlackfeetBolivianBrazilianBritishBritish West IndianBulgarianBurmeseCajunCambodianCanadianCape VerdeanCarpatho RusynCelticCentral AmericanCentral American IndianCherokeeCheyenneChickasawChileanChineseChippewaChoctawColombianColvilleComancheCosta RicanCreeCreekCroatianCrowCubanCypriotCzechCzechoslovakianDanishDelawareDominicanDutchDutch West IndianEastern EuropeanEcuadorianEgyptianEnglishEstonianEthiopianEuropeanFijianFilipinoFinnishFrenchFrench American IndianFrench CanadianGermanGerman RussianGhanaianGreekGuamanian/ChamorroGuatemalanGuyaneseHaitianHmongHonduranHopiHoumaHungarianIcelanderIndian (Asian)IndonesianInupiatIranianIraqiIrishIroquoisIsraeliItalianJamaicanJapaneseJordanianKenyanKiowaKoreanLaotianLatvianLebaneseLiberianLithuanianLumbeeLuxembourgerMacedonianMalaysianMalteseMarshalleseMenomineeMexicanMexican American IndianMongolianMoroccanNative HawaiianNavajoNepaleseNew ZealanderNicaraguanNigerianNorthern EuropeanNorwegianOkinawanOsageOttawaPaiutePakistaniPalestinianPanamanianParaguayanPennsylvania GermanPeruvianPimaPolishPortuguesePotawatomiPuebloPuerto RicanPuget Sound SalishRomanianSalvadoranSamoanScandinavianScotch-IrishScottishSeminoleSenegaleseSerbianShoshoneSierra LeoneanSiouxSlavicSlovakSloveneSomaliSouth AfricanSouth AmericanSouth American IndianSoviet UnionSpaniardSpanishSpanish AmericanSpanish American IndianSri LankanSubsaharan AfricanSudaneseSwedishSwissSyrianTaiwaneseThaiTlingit-HaidaTohono O'OdhamTonganTrinidadian and TobagonianTsimshianTurkishU.S. Virgin IslanderUgandanUkrainianUruguayanUteVenezuelanVietnameseWelshWest IndianYakamaYaquiYugoslavianYumanYup'ikZimbabwean
Immigration
NonimmigrantsImmigrantsAfghanistanAfricaAlbaniaArgentinaArmeniaAsiaAustraliaAustriaBahamasBangladeshBarbadosBelarusBelgiumBelizeBoliviaBosnia and HerzegovinaBrazilBulgariaBurma/MyanmarCabo VerdeCambodiaCameroonCanadaCaribbeanCentral AmericaChileChinaColombiaCongoCosta RicaCroatiaCubaCzechoslovakiaDenmarkDominicaDominican RepublicEastern AfricaEastern AsiaEastern EuropeEcuadorEgyptEl SalvadorEnglandEritreaEthiopiaEuropeFijiFranceGermanyGhanaGreeceGrenadaGuatemalaGuyanaHaitiHondurasHong KongHungaryIndiaIndonesiaIranIraqIrelandIsraelItalyJamaicaJapanJordanKazakhstanKenyaKoreaKuwaitLaosLatin AmericaLatviaLebanonLiberiaLithuaniaMalaysiaMexicoMicronesiaMiddle AfricaMoldovaMoroccoNepalNetherlandsNicaraguaNigeriaNorth AmericaNorth MacedoniaNorthern AfricaNorthern EuropeNorwayOceaniaPakistanPanamaPeruPhilippinesPolandPortugalRomaniaRussiaSaudi ArabiaScotlandSenegalSerbiaSierra LeoneSingaporeSomaliaSouth AfricaSouth AmericaSouth Central AsiaSouth Eastern AsiaSouthern EuropeSpainSri LankaSt. Vincent and the GrenadinesSudanSwedenSwitzerlandSyriaTaiwanThailandTrinidad and TobagoTurkeyUgandaUkraineUruguayUzbekistanVenezuelaVietnamWest IndiesWestern AfricaWestern AsiaWestern EuropeYemenZaireZimbabweAzores
Householder Income Over 65 years
Income
Poverty
Unemployment
Labor Participation
Family Structure
Vehicle Availability
Education Level
Disability

Householder Income Over 65 years Comparison

Russians

Peruvians

Exceptional
Excellent
$67,626
HOUSEHOLDER INCOME OVER 65 YEARS
99.9/ 100
METRIC RATING
39th/ 347
METRIC RANK
$62,766
HOUSEHOLDER INCOME OVER 65 YEARS
86.8/ 100
METRIC RATING
126th/ 347
METRIC RANK

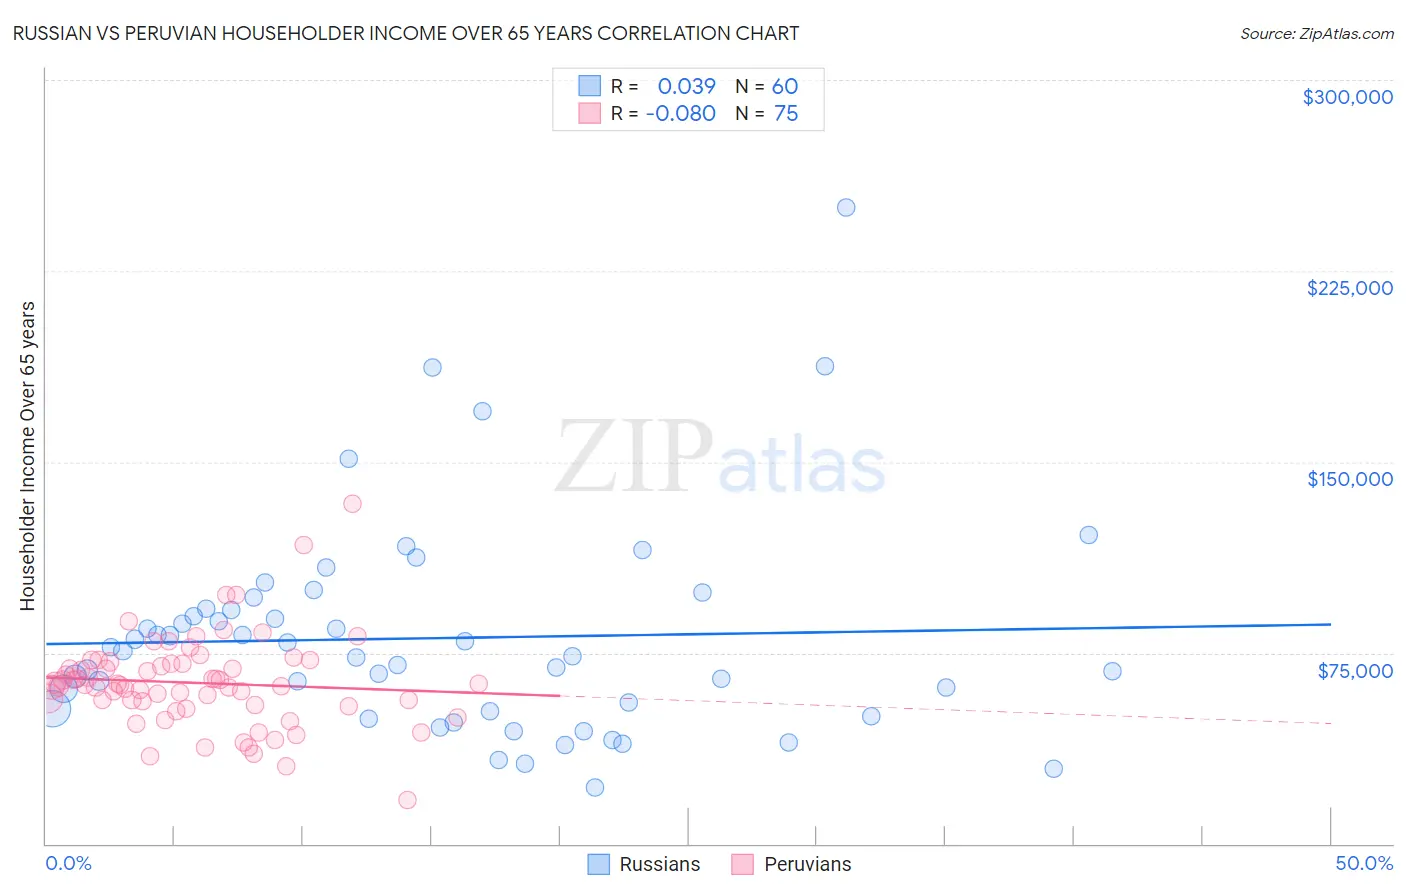
Russian vs Peruvian Householder Income Over 65 years Correlation Chart

The statistical analysis conducted on geographies consisting of 509,158,654 people shows no correlation between the proportion of Russians and household income with householder over the age of 65 in the United States with a correlation coefficient (R) of 0.039 and weighted average of $67,626. Similarly, the statistical analysis conducted on geographies consisting of 361,900,663 people shows a slight negative correlation between the proportion of Peruvians and household income with householder over the age of 65 in the United States with a correlation coefficient (R) of -0.080 and weighted average of $62,766, a difference of 7.7%.
Russian vs Peruvian Householder Income Over 65 years

Householder Income Over 65 years Correlation Summary

MeasurementRussianPeruvian
Minimum$22,236$17,083
Maximum$250,001$133,750
Range$227,765$116,667
Mean$80,788$63,177
Median$74,810$62,351
Interquartile 25% (IQ1)$52,373$54,608
Interquartile 75% (IQ3)$92,060$70,924
Interquartile Range (IQR)$39,687$16,316
Standard Deviation (Sample)$41,509$17,972
Standard Deviation (Population)$41,162$17,852

Similar Demographics by Householder Income Over 65 years

Demographics Similar to Russians by Householder Income Over 65 years

In terms of householder income over 65 years, the demographic groups most similar to Russians are Immigrants from Asia ($67,594, a difference of 0.050%), Korean ($67,472, a difference of 0.23%), Estonian ($67,926, a difference of 0.44%), New Zealander ($67,333, a difference of 0.44%), and Latvian ($67,326, a difference of 0.45%).
DemographicsRating | RankHouseholder Income Over 65 years
Asians
100.0
/100
|
#32
Exceptional
$68,822
Immigrants | Denmark
100.0
/100
|
#33
Exceptional
$68,801
Immigrants | Ireland
100.0
/100
|
#34
Exceptional
$68,495
Tongans
100.0
/100
|
#35
Exceptional
$68,235
Immigrants | Austria
99.9
/100
|
#36
Exceptional
$68,208
Turks
99.9
/100
|
#37
Exceptional
$68,037
Estonians
99.9
/100
|
#38
Exceptional
$67,926
Russians
99.9
/100
|
#39
Exceptional
$67,626
Immigrants | Asia
99.9
/100
|
#40
Exceptional
$67,594
Koreans
99.9
/100
|
#41
Exceptional
$67,472
New Zealanders
99.9
/100
|
#42
Exceptional
$67,333
Latvians
99.9
/100
|
#43
Exceptional
$67,326
Immigrants | South Africa
99.9
/100
|
#44
Exceptional
$67,234
Immigrants | Afghanistan
99.8
/100
|
#45
Exceptional
$67,007
Cambodians
99.8
/100
|
#46
Exceptional
$66,892

Demographics Similar to Peruvians by Householder Income Over 65 years

In terms of householder income over 65 years, the demographic groups most similar to Peruvians are Swedish ($62,736, a difference of 0.050%), Aleut ($62,708, a difference of 0.090%), Immigrants from Eastern Europe ($62,693, a difference of 0.12%), Soviet Union ($62,848, a difference of 0.13%), and Basque ($62,653, a difference of 0.18%).
DemographicsRating | RankHouseholder Income Over 65 years
Immigrants | Jordan
89.8
/100
|
#119
Excellent
$63,041
Ukrainians
89.7
/100
|
#120
Excellent
$63,032
Immigrants | Vietnam
89.5
/100
|
#121
Excellent
$63,014
Immigrants | Moldova
88.7
/100
|
#122
Excellent
$62,939
Tlingit-Haida
88.6
/100
|
#123
Excellent
$62,922
Taiwanese
88.3
/100
|
#124
Excellent
$62,894
Soviet Union
87.8
/100
|
#125
Excellent
$62,848
Peruvians
86.8
/100
|
#126
Excellent
$62,766
Swedes
86.4
/100
|
#127
Excellent
$62,736
Aleuts
86.1
/100
|
#128
Excellent
$62,708
Immigrants | Eastern Europe
85.9
/100
|
#129
Excellent
$62,693
Basques
85.4
/100
|
#130
Excellent
$62,653
Immigrants | Western Asia
85.3
/100
|
#131
Excellent
$62,645
Immigrants | Germany
83.9
/100
|
#132
Excellent
$62,544
Immigrants | Northern Africa
83.6
/100
|
#133
Excellent
$62,522