Immigrants from Bolivia vs Okinawan Median Household Income
COMPARE
Immigrants from Bolivia
Okinawan
Median Household Income
Median Household Income Comparison
Immigrants from Bolivia
Okinawans
$101,394
MEDIAN HOUSEHOLD INCOME
100.0/ 100
METRIC RATING
23rd/ 347
METRIC RANK
$106,624
MEDIAN HOUSEHOLD INCOME
100.0/ 100
METRIC RATING
9th/ 347
METRIC RANK
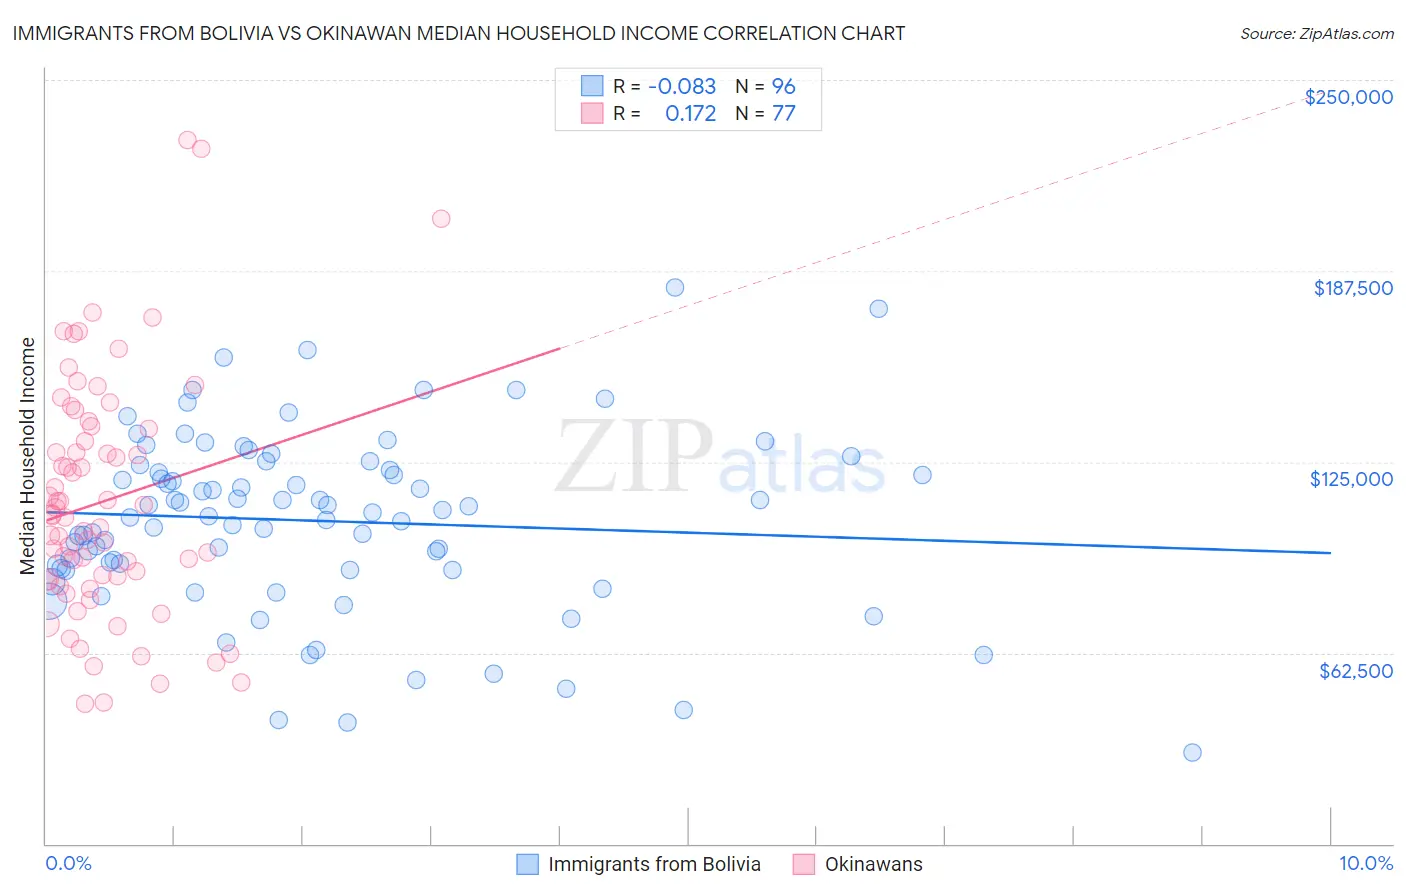
Immigrants from Bolivia vs Okinawan Median Household Income Correlation Chart
The statistical analysis conducted on geographies consisting of 158,713,567 people shows a slight negative correlation between the proportion of Immigrants from Bolivia and median household income in the United States with a correlation coefficient (R) of -0.083 and weighted average of $101,394. Similarly, the statistical analysis conducted on geographies consisting of 73,710,958 people shows a poor positive correlation between the proportion of Okinawans and median household income in the United States with a correlation coefficient (R) of 0.172 and weighted average of $106,624, a difference of 5.2%.
Median Household Income Correlation Summary
| Measurement | Immigrants from Bolivia | Okinawan |
| Minimum | $29,844 | $46,026 |
| Maximum | $182,250 | $230,434 |
| Range | $152,406 | $184,408 |
| Mean | $105,682 | $112,091 |
| Median | $107,900 | $107,483 |
| Interquartile 25% (IQ1) | $89,971 | $86,369 |
| Interquartile 75% (IQ3) | $123,106 | $136,400 |
| Interquartile Range (IQR) | $33,135 | $50,031 |
| Standard Deviation (Sample) | $29,190 | $39,077 |
| Standard Deviation (Population) | $29,037 | $38,823 |
Demographics Similar to Immigrants from Bolivia and Okinawans by Median Household Income
In terms of median household income, the demographic groups most similar to Immigrants from Bolivia are Asian ($101,681, a difference of 0.28%), Eastern European ($101,781, a difference of 0.38%), Immigrants from Japan ($100,711, a difference of 0.68%), Immigrants from Sweden ($100,699, a difference of 0.69%), and Bolivian ($102,195, a difference of 0.79%). Similarly, the demographic groups most similar to Okinawans are Immigrants from South Central Asia ($106,057, a difference of 0.53%), Immigrants from China ($105,335, a difference of 1.2%), Indian (Asian) ($105,262, a difference of 1.3%), Immigrants from Iran ($108,055, a difference of 1.3%), and Immigrants from Eastern Asia ($104,796, a difference of 1.7%).
| Demographics | Rating | Rank | Median Household Income |
| Immigrants | Singapore | 100.0 /100 | #6 | Exceptional $110,428 |
| Iranians | 100.0 /100 | #7 | Exceptional $109,835 |
| Immigrants | Iran | 100.0 /100 | #8 | Exceptional $108,055 |
| Okinawans | 100.0 /100 | #9 | Exceptional $106,624 |
| Immigrants | South Central Asia | 100.0 /100 | #10 | Exceptional $106,057 |
| Immigrants | China | 100.0 /100 | #11 | Exceptional $105,335 |
| Indians (Asian) | 100.0 /100 | #12 | Exceptional $105,262 |
| Immigrants | Eastern Asia | 100.0 /100 | #13 | Exceptional $104,796 |
| Immigrants | Ireland | 100.0 /100 | #14 | Exceptional $104,692 |
| Immigrants | Israel | 100.0 /100 | #15 | Exceptional $104,090 |
| Burmese | 100.0 /100 | #16 | Exceptional $103,145 |
| Immigrants | Korea | 100.0 /100 | #17 | Exceptional $102,962 |
| Cypriots | 100.0 /100 | #18 | Exceptional $102,843 |
| Immigrants | Australia | 100.0 /100 | #19 | Exceptional $102,562 |
| Bolivians | 100.0 /100 | #20 | Exceptional $102,195 |
| Eastern Europeans | 100.0 /100 | #21 | Exceptional $101,781 |
| Asians | 100.0 /100 | #22 | Exceptional $101,681 |
| Immigrants | Bolivia | 100.0 /100 | #23 | Exceptional $101,394 |
| Immigrants | Japan | 100.0 /100 | #24 | Exceptional $100,711 |
| Immigrants | Sweden | 100.0 /100 | #25 | Exceptional $100,699 |
| Immigrants | Belgium | 100.0 /100 | #26 | Exceptional $100,306 |