Osage vs Immigrants from Zaire Householder Income Under 25 years
COMPARE
Osage
Immigrants from Zaire
Householder Income Under 25 years
Householder Income Under 25 years Comparison
Osage
Immigrants from Zaire
$45,764
HOUSEHOLDER INCOME UNDER 25 YEARS
0.0/ 100
METRIC RATING
326th/ 347
METRIC RANK
$45,529
HOUSEHOLDER INCOME UNDER 25 YEARS
0.0/ 100
METRIC RATING
331st/ 347
METRIC RANK
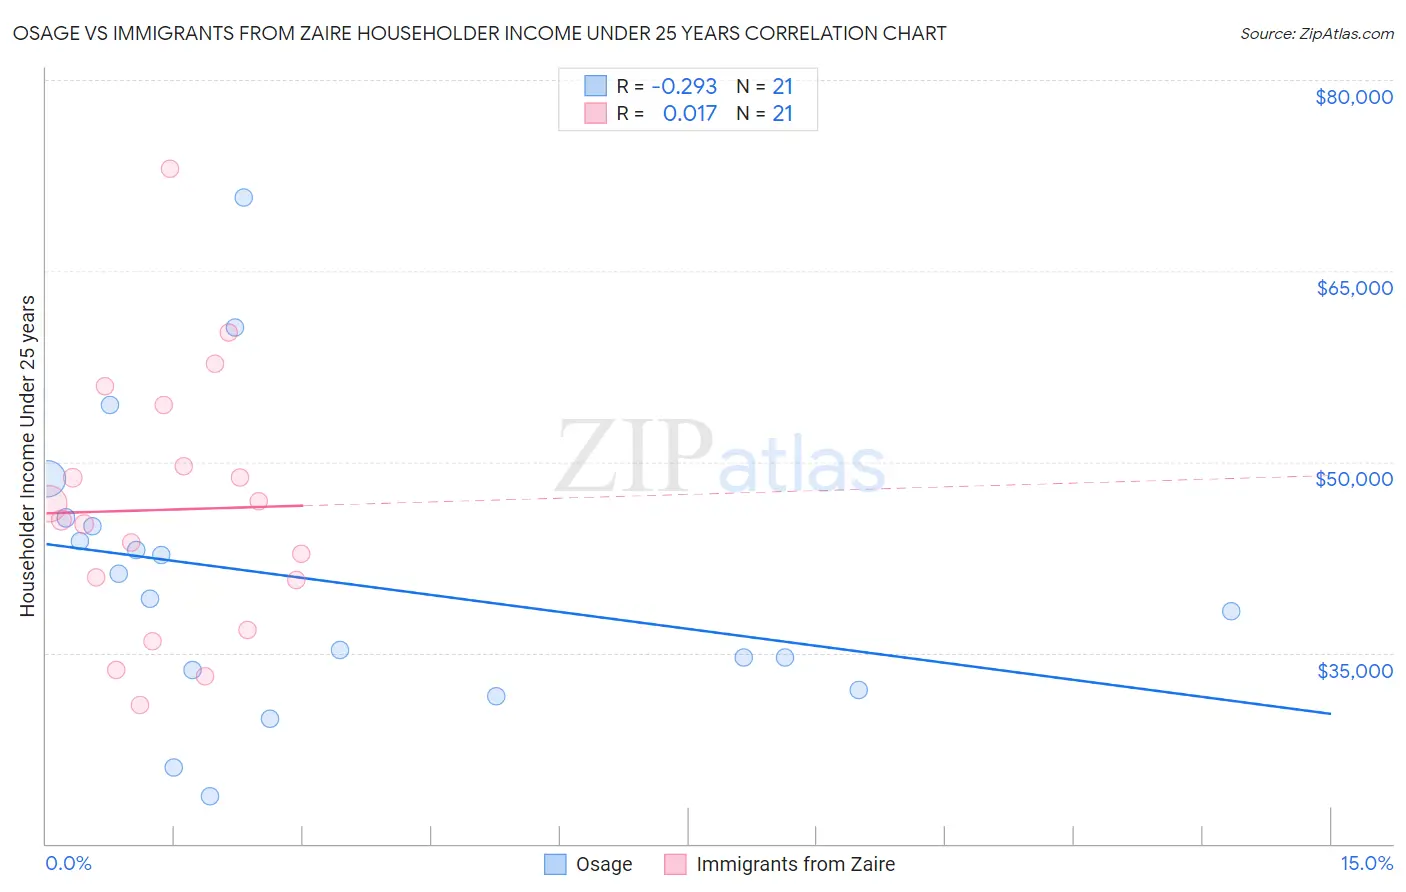
Osage vs Immigrants from Zaire Householder Income Under 25 years Correlation Chart
The statistical analysis conducted on geographies consisting of 87,289,691 people shows a weak negative correlation between the proportion of Osage and household income with householder under the age of 25 in the United States with a correlation coefficient (R) of -0.293 and weighted average of $45,764. Similarly, the statistical analysis conducted on geographies consisting of 101,704,026 people shows no correlation between the proportion of Immigrants from Zaire and household income with householder under the age of 25 in the United States with a correlation coefficient (R) of 0.017 and weighted average of $45,529, a difference of 0.52%.
Householder Income Under 25 years Correlation Summary
| Measurement | Osage | Immigrants from Zaire |
| Minimum | $23,750 | $30,877 |
| Maximum | $70,795 | $73,045 |
| Range | $47,045 | $42,168 |
| Mean | $40,691 | $46,246 |
| Median | $39,256 | $45,465 |
| Interquartile 25% (IQ1) | $32,844 | $38,741 |
| Interquartile 75% (IQ3) | $45,298 | $52,065 |
| Interquartile Range (IQR) | $12,454 | $13,324 |
| Standard Deviation (Sample) | $11,304 | $10,181 |
| Standard Deviation (Population) | $11,031 | $9,936 |
Demographics Similar to Osage and Immigrants from Zaire by Householder Income Under 25 years
In terms of householder income under 25 years, the demographic groups most similar to Osage are Bahamian ($45,743, a difference of 0.050%), Immigrants from Bahamas ($45,793, a difference of 0.060%), Dutch West Indian ($45,816, a difference of 0.11%), German Russian ($45,673, a difference of 0.20%), and Seminole ($45,649, a difference of 0.25%). Similarly, the demographic groups most similar to Immigrants from Zaire are Indonesian ($45,566, a difference of 0.080%), Choctaw ($45,450, a difference of 0.17%), Seminole ($45,649, a difference of 0.26%), German Russian ($45,673, a difference of 0.32%), and Creek ($45,371, a difference of 0.35%).
| Demographics | Rating | Rank | Householder Income Under 25 years |
| Spanish Americans | 0.0 /100 | #318 | Tragic $46,913 |
| Africans | 0.0 /100 | #319 | Tragic $46,838 |
| Immigrants | Sudan | 0.0 /100 | #320 | Tragic $46,791 |
| Potawatomi | 0.0 /100 | #321 | Tragic $46,462 |
| Sioux | 0.0 /100 | #322 | Tragic $46,417 |
| Immigrants | Saudi Arabia | 0.0 /100 | #323 | Tragic $46,187 |
| Dutch West Indians | 0.0 /100 | #324 | Tragic $45,816 |
| Immigrants | Bahamas | 0.0 /100 | #325 | Tragic $45,793 |
| Osage | 0.0 /100 | #326 | Tragic $45,764 |
| Bahamians | 0.0 /100 | #327 | Tragic $45,743 |
| German Russians | 0.0 /100 | #328 | Tragic $45,673 |
| Seminole | 0.0 /100 | #329 | Tragic $45,649 |
| Indonesians | 0.0 /100 | #330 | Tragic $45,566 |
| Immigrants | Zaire | 0.0 /100 | #331 | Tragic $45,529 |
| Choctaw | 0.0 /100 | #332 | Tragic $45,450 |
| Creek | 0.0 /100 | #333 | Tragic $45,371 |
| Cajuns | 0.0 /100 | #334 | Tragic $45,338 |
| Cheyenne | 0.0 /100 | #335 | Tragic $45,275 |
| Tohono O'odham | 0.0 /100 | #336 | Tragic $45,248 |
| Pueblo | 0.0 /100 | #337 | Tragic $45,018 |
| Chickasaw | 0.0 /100 | #338 | Tragic $44,763 |