Osage vs Delaware Householder Income Under 25 years
COMPARE
Osage
Delaware
Householder Income Under 25 years
Householder Income Under 25 years Comparison
Osage
Delaware
$45,764
HOUSEHOLDER INCOME UNDER 25 YEARS
0.0/ 100
METRIC RATING
326th/ 347
METRIC RANK
$47,159
HOUSEHOLDER INCOME UNDER 25 YEARS
0.0/ 100
METRIC RATING
313th/ 347
METRIC RANK
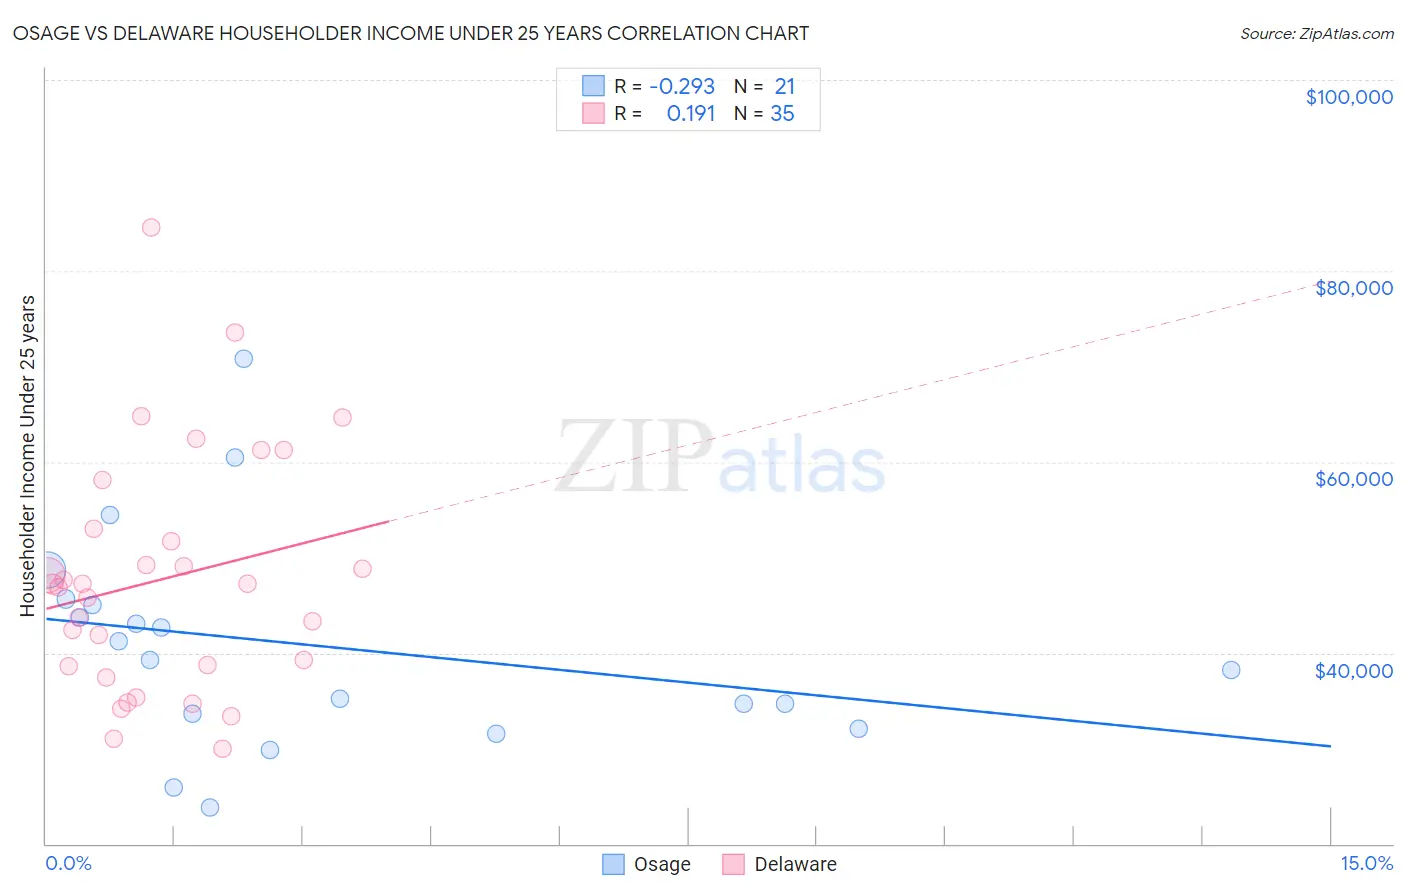
Osage vs Delaware Householder Income Under 25 years Correlation Chart
The statistical analysis conducted on geographies consisting of 87,289,691 people shows a weak negative correlation between the proportion of Osage and household income with householder under the age of 25 in the United States with a correlation coefficient (R) of -0.293 and weighted average of $45,764. Similarly, the statistical analysis conducted on geographies consisting of 88,840,483 people shows a poor positive correlation between the proportion of Delaware and household income with householder under the age of 25 in the United States with a correlation coefficient (R) of 0.191 and weighted average of $47,159, a difference of 3.0%.
Householder Income Under 25 years Correlation Summary
| Measurement | Osage | Delaware |
| Minimum | $23,750 | $30,000 |
| Maximum | $70,795 | $84,491 |
| Range | $47,045 | $54,491 |
| Mean | $40,691 | $47,740 |
| Median | $39,256 | $47,185 |
| Interquartile 25% (IQ1) | $32,844 | $38,611 |
| Interquartile 75% (IQ3) | $45,298 | $52,932 |
| Interquartile Range (IQR) | $12,454 | $14,321 |
| Standard Deviation (Sample) | $11,304 | $12,436 |
| Standard Deviation (Population) | $11,031 | $12,258 |
Demographics Similar to Osage and Delaware by Householder Income Under 25 years
In terms of householder income under 25 years, the demographic groups most similar to Osage are Bahamian ($45,743, a difference of 0.050%), Immigrants from Bahamas ($45,793, a difference of 0.060%), Dutch West Indian ($45,816, a difference of 0.11%), German Russian ($45,673, a difference of 0.20%), and Seminole ($45,649, a difference of 0.25%). Similarly, the demographic groups most similar to Delaware are Chippewa ($47,015, a difference of 0.31%), Crow ($47,012, a difference of 0.31%), Sudanese ($46,982, a difference of 0.38%), Hopi ($46,978, a difference of 0.39%), and Bermudan ($47,359, a difference of 0.43%).
| Demographics | Rating | Rank | Householder Income Under 25 years |
| U.S. Virgin Islanders | 0.0 /100 | #309 | Tragic $47,448 |
| Iroquois | 0.0 /100 | #310 | Tragic $47,380 |
| Ottawa | 0.0 /100 | #311 | Tragic $47,366 |
| Bermudans | 0.0 /100 | #312 | Tragic $47,359 |
| Delaware | 0.0 /100 | #313 | Tragic $47,159 |
| Chippewa | 0.0 /100 | #314 | Tragic $47,015 |
| Crow | 0.0 /100 | #315 | Tragic $47,012 |
| Sudanese | 0.0 /100 | #316 | Tragic $46,982 |
| Hopi | 0.0 /100 | #317 | Tragic $46,978 |
| Spanish Americans | 0.0 /100 | #318 | Tragic $46,913 |
| Africans | 0.0 /100 | #319 | Tragic $46,838 |
| Immigrants | Sudan | 0.0 /100 | #320 | Tragic $46,791 |
| Potawatomi | 0.0 /100 | #321 | Tragic $46,462 |
| Sioux | 0.0 /100 | #322 | Tragic $46,417 |
| Immigrants | Saudi Arabia | 0.0 /100 | #323 | Tragic $46,187 |
| Dutch West Indians | 0.0 /100 | #324 | Tragic $45,816 |
| Immigrants | Bahamas | 0.0 /100 | #325 | Tragic $45,793 |
| Osage | 0.0 /100 | #326 | Tragic $45,764 |
| Bahamians | 0.0 /100 | #327 | Tragic $45,743 |
| German Russians | 0.0 /100 | #328 | Tragic $45,673 |
| Seminole | 0.0 /100 | #329 | Tragic $45,649 |