Immigrants from North America vs Immigrants from South America Householder Income Ages 25 - 44 years
COMPARE
Immigrants from North America
Immigrants from South America
Householder Income Ages 25 - 44 years
Householder Income Ages 25 - 44 years Comparison
Immigrants from North America
Immigrants from South America
$102,407
HOUSEHOLDER INCOME AGES 25 - 44 YEARS
98.7/ 100
METRIC RATING
92nd/ 347
METRIC RANK
$94,042
HOUSEHOLDER INCOME AGES 25 - 44 YEARS
42.8/ 100
METRIC RATING
178th/ 347
METRIC RANK
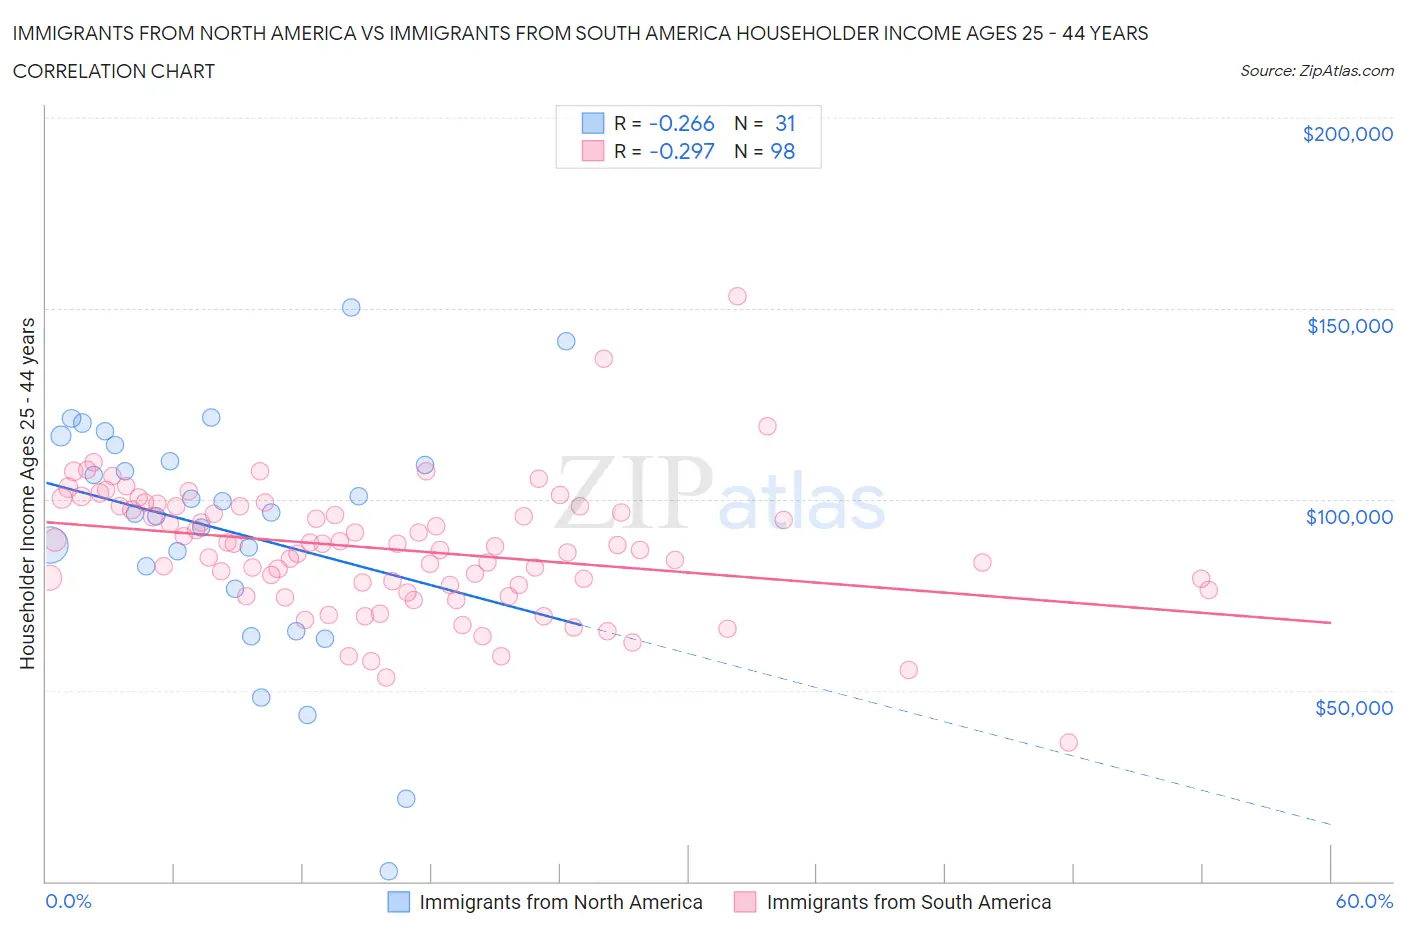
Immigrants from North America vs Immigrants from South America Householder Income Ages 25 - 44 years Correlation Chart
The statistical analysis conducted on geographies consisting of 460,647,822 people shows a weak negative correlation between the proportion of Immigrants from North America and household income with householder between the ages 25 and 44 in the United States with a correlation coefficient (R) of -0.266 and weighted average of $102,407. Similarly, the statistical analysis conducted on geographies consisting of 484,511,014 people shows a weak negative correlation between the proportion of Immigrants from South America and household income with householder between the ages 25 and 44 in the United States with a correlation coefficient (R) of -0.297 and weighted average of $94,042, a difference of 8.9%.
Householder Income Ages 25 - 44 years Correlation Summary
| Measurement | Immigrants from North America | Immigrants from South America |
| Minimum | $2,499 | $36,176 |
| Maximum | $150,179 | $153,313 |
| Range | $147,680 | $117,137 |
| Mean | $91,829 | $86,995 |
| Median | $96,656 | $87,907 |
| Interquartile 25% (IQ1) | $76,535 | $77,429 |
| Interquartile 75% (IQ3) | $114,168 | $98,212 |
| Interquartile Range (IQR) | $37,632 | $20,783 |
| Standard Deviation (Sample) | $32,309 | $16,981 |
| Standard Deviation (Population) | $31,784 | $16,895 |
Similar Demographics by Householder Income Ages 25 - 44 years
Demographics Similar to Immigrants from North America by Householder Income Ages 25 - 44 years
In terms of householder income ages 25 - 44 years, the demographic groups most similar to Immigrants from North America are Croatian ($102,414, a difference of 0.010%), Ukrainian ($102,451, a difference of 0.040%), Romanian ($102,544, a difference of 0.13%), Immigrants from Canada ($102,616, a difference of 0.20%), and Immigrants from Hungary ($102,655, a difference of 0.24%).
| Demographics | Rating | Rank | Householder Income Ages 25 - 44 years |
| Immigrants | Ukraine | 98.9 /100 | #85 | Exceptional $102,664 |
| Immigrants | Hungary | 98.9 /100 | #86 | Exceptional $102,655 |
| Immigrants | Western Europe | 98.9 /100 | #87 | Exceptional $102,654 |
| Immigrants | Canada | 98.9 /100 | #88 | Exceptional $102,616 |
| Romanians | 98.8 /100 | #89 | Exceptional $102,544 |
| Ukrainians | 98.8 /100 | #90 | Exceptional $102,451 |
| Croatians | 98.7 /100 | #91 | Exceptional $102,414 |
| Immigrants | North America | 98.7 /100 | #92 | Exceptional $102,407 |
| Immigrants | England | 98.4 /100 | #93 | Exceptional $102,020 |
| Sri Lankans | 98.4 /100 | #94 | Exceptional $101,960 |
| Assyrians/Chaldeans/Syriacs | 98.3 /100 | #95 | Exceptional $101,936 |
| Macedonians | 98.3 /100 | #96 | Exceptional $101,882 |
| Austrians | 98.3 /100 | #97 | Exceptional $101,842 |
| Immigrants | Kazakhstan | 98.1 /100 | #98 | Exceptional $101,727 |
| Taiwanese | 97.9 /100 | #99 | Exceptional $101,492 |
Demographics Similar to Immigrants from South America by Householder Income Ages 25 - 44 years
In terms of householder income ages 25 - 44 years, the demographic groups most similar to Immigrants from South America are Belgian ($94,262, a difference of 0.23%), French Canadian ($93,694, a difference of 0.37%), Immigrants ($94,423, a difference of 0.40%), French ($93,665, a difference of 0.40%), and English ($94,429, a difference of 0.41%).
| Demographics | Rating | Rank | Householder Income Ages 25 - 44 years |
| Immigrants | Armenia | 54.2 /100 | #171 | Average $94,867 |
| Scottish | 50.8 /100 | #172 | Average $94,622 |
| Finns | 50.6 /100 | #173 | Average $94,610 |
| Colombians | 50.0 /100 | #174 | Average $94,565 |
| English | 48.1 /100 | #175 | Average $94,429 |
| Immigrants | Immigrants | 48.0 /100 | #176 | Average $94,423 |
| Belgians | 45.8 /100 | #177 | Average $94,262 |
| Immigrants | South America | 42.8 /100 | #178 | Average $94,042 |
| French Canadians | 38.2 /100 | #179 | Fair $93,694 |
| French | 37.8 /100 | #180 | Fair $93,665 |
| Puget Sound Salish | 37.7 /100 | #181 | Fair $93,661 |
| Uruguayans | 37.3 /100 | #182 | Fair $93,631 |
| Guamanians/Chamorros | 36.5 /100 | #183 | Fair $93,569 |
| Germans | 36.0 /100 | #184 | Fair $93,531 |
| Immigrants | Eritrea | 35.2 /100 | #185 | Fair $93,466 |