Moroccan vs Immigrants from South America Householder Income Ages 25 - 44 years
COMPARE
Moroccan
Immigrants from South America
Householder Income Ages 25 - 44 years
Householder Income Ages 25 - 44 years Comparison
Moroccans
Immigrants from South America
$96,117
HOUSEHOLDER INCOME AGES 25 - 44 YEARS
70.3/ 100
METRIC RATING
155th/ 347
METRIC RANK
$94,042
HOUSEHOLDER INCOME AGES 25 - 44 YEARS
42.8/ 100
METRIC RATING
178th/ 347
METRIC RANK
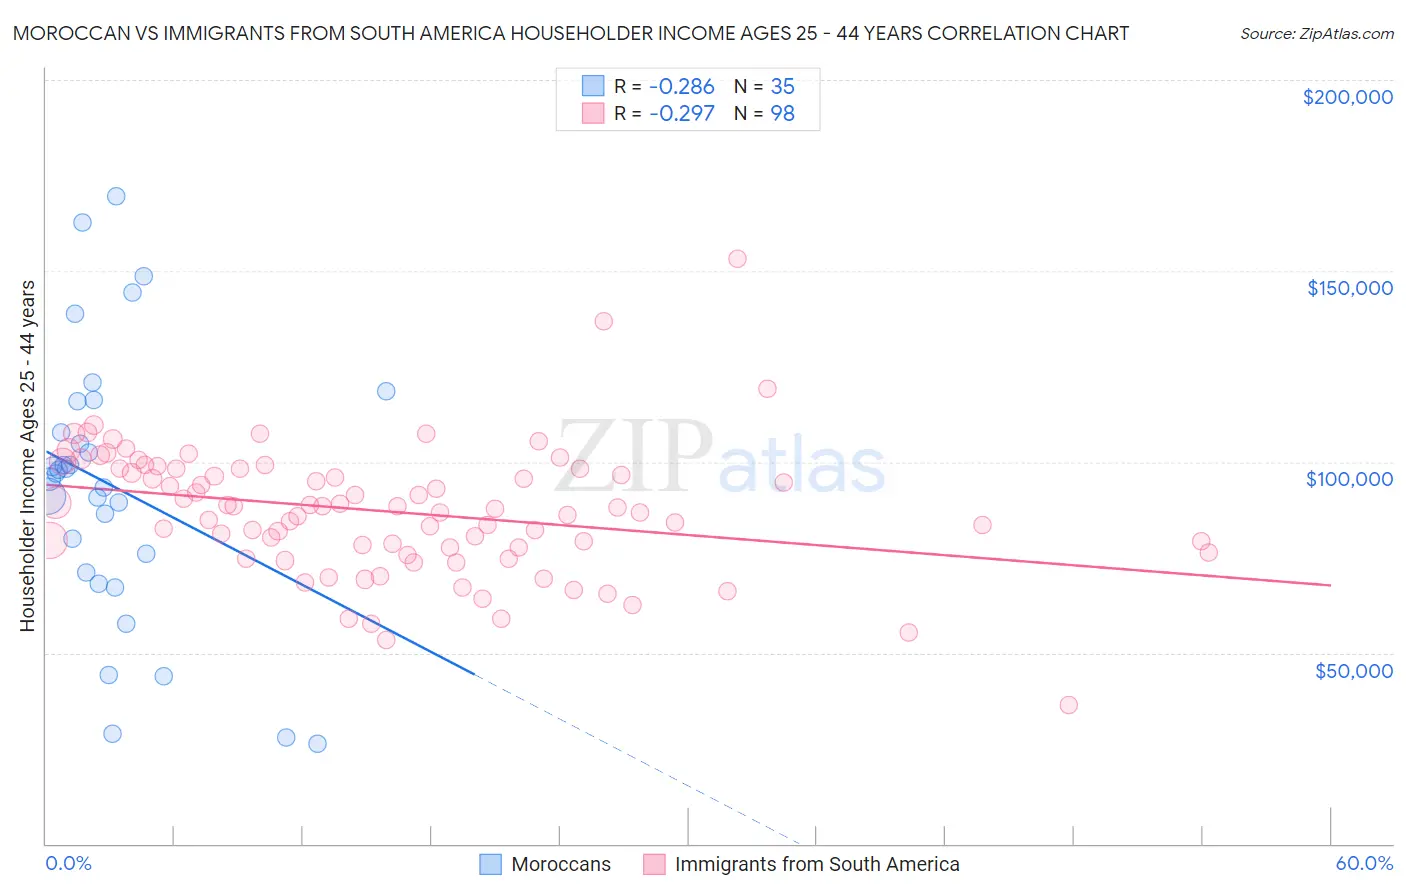
Moroccan vs Immigrants from South America Householder Income Ages 25 - 44 years Correlation Chart
The statistical analysis conducted on geographies consisting of 201,535,372 people shows a weak negative correlation between the proportion of Moroccans and household income with householder between the ages 25 and 44 in the United States with a correlation coefficient (R) of -0.286 and weighted average of $96,117. Similarly, the statistical analysis conducted on geographies consisting of 484,511,014 people shows a weak negative correlation between the proportion of Immigrants from South America and household income with householder between the ages 25 and 44 in the United States with a correlation coefficient (R) of -0.297 and weighted average of $94,042, a difference of 2.2%.
Householder Income Ages 25 - 44 years Correlation Summary
| Measurement | Moroccan | Immigrants from South America |
| Minimum | $26,250 | $36,176 |
| Maximum | $169,563 | $153,313 |
| Range | $143,313 | $117,137 |
| Mean | $93,636 | $86,995 |
| Median | $96,963 | $87,907 |
| Interquartile 25% (IQ1) | $70,962 | $77,429 |
| Interquartile 75% (IQ3) | $115,732 | $98,212 |
| Interquartile Range (IQR) | $44,770 | $20,783 |
| Standard Deviation (Sample) | $35,487 | $16,981 |
| Standard Deviation (Population) | $34,976 | $16,895 |
Similar Demographics by Householder Income Ages 25 - 44 years
Demographics Similar to Moroccans by Householder Income Ages 25 - 44 years
In terms of householder income ages 25 - 44 years, the demographic groups most similar to Moroccans are Immigrants from Germany ($95,913, a difference of 0.21%), Slavic ($96,377, a difference of 0.27%), Slovene ($96,439, a difference of 0.33%), South American Indian ($96,497, a difference of 0.40%), and Czech ($96,525, a difference of 0.42%).
| Demographics | Rating | Rank | Householder Income Ages 25 - 44 years |
| Irish | 76.9 /100 | #148 | Good $96,730 |
| Basques | 76.6 /100 | #149 | Good $96,709 |
| Ugandans | 76.2 /100 | #150 | Good $96,667 |
| Czechs | 74.8 /100 | #151 | Good $96,525 |
| South American Indians | 74.5 /100 | #152 | Good $96,497 |
| Slovenes | 73.9 /100 | #153 | Good $96,439 |
| Slavs | 73.2 /100 | #154 | Good $96,377 |
| Moroccans | 70.3 /100 | #155 | Good $96,117 |
| Immigrants | Germany | 67.9 /100 | #156 | Good $95,913 |
| Immigrants | Uganda | 65.2 /100 | #157 | Good $95,698 |
| Scandinavians | 63.9 /100 | #158 | Good $95,596 |
| Costa Ricans | 63.5 /100 | #159 | Good $95,565 |
| Icelanders | 63.4 /100 | #160 | Good $95,560 |
| Immigrants | Portugal | 62.8 /100 | #161 | Good $95,512 |
| Swiss | 62.8 /100 | #162 | Good $95,511 |
Demographics Similar to Immigrants from South America by Householder Income Ages 25 - 44 years
In terms of householder income ages 25 - 44 years, the demographic groups most similar to Immigrants from South America are Belgian ($94,262, a difference of 0.23%), French Canadian ($93,694, a difference of 0.37%), Immigrants ($94,423, a difference of 0.40%), French ($93,665, a difference of 0.40%), and English ($94,429, a difference of 0.41%).
| Demographics | Rating | Rank | Householder Income Ages 25 - 44 years |
| Immigrants | Armenia | 54.2 /100 | #171 | Average $94,867 |
| Scottish | 50.8 /100 | #172 | Average $94,622 |
| Finns | 50.6 /100 | #173 | Average $94,610 |
| Colombians | 50.0 /100 | #174 | Average $94,565 |
| English | 48.1 /100 | #175 | Average $94,429 |
| Immigrants | Immigrants | 48.0 /100 | #176 | Average $94,423 |
| Belgians | 45.8 /100 | #177 | Average $94,262 |
| Immigrants | South America | 42.8 /100 | #178 | Average $94,042 |
| French Canadians | 38.2 /100 | #179 | Fair $93,694 |
| French | 37.8 /100 | #180 | Fair $93,665 |
| Puget Sound Salish | 37.7 /100 | #181 | Fair $93,661 |
| Uruguayans | 37.3 /100 | #182 | Fair $93,631 |
| Guamanians/Chamorros | 36.5 /100 | #183 | Fair $93,569 |
| Germans | 36.0 /100 | #184 | Fair $93,531 |
| Immigrants | Eritrea | 35.2 /100 | #185 | Fair $93,466 |