Osage vs Immigrants from Ethiopia Female Poverty Among 25-34 Year Olds
COMPARE
Osage
Immigrants from Ethiopia
Female Poverty Among 25-34 Year Olds
Female Poverty Among 25-34 Year Olds Comparison
Osage
Immigrants from Ethiopia
16.4%
FEMALE POVERTY AMONG 25-34 YEAR OLDS
0.0/ 100
METRIC RATING
289th/ 347
METRIC RANK
12.6%
FEMALE POVERTY AMONG 25-34 YEAR OLDS
96.5/ 100
METRIC RATING
98th/ 347
METRIC RANK
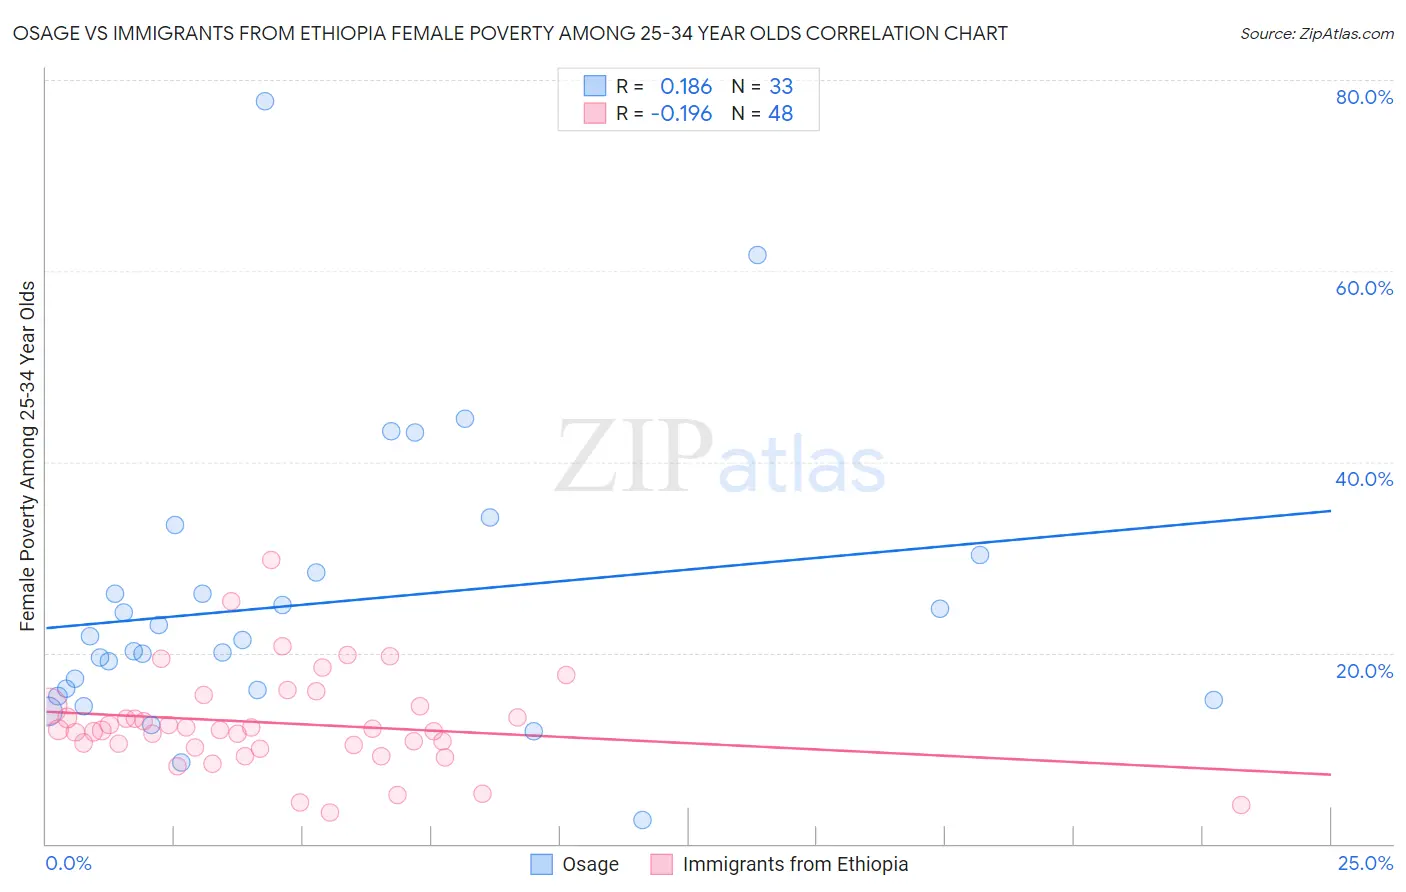
Osage vs Immigrants from Ethiopia Female Poverty Among 25-34 Year Olds Correlation Chart
The statistical analysis conducted on geographies consisting of 91,487,860 people shows a poor positive correlation between the proportion of Osage and poverty level among females between the ages 25 and 34 in the United States with a correlation coefficient (R) of 0.186 and weighted average of 16.4%. Similarly, the statistical analysis conducted on geographies consisting of 210,146,799 people shows a poor negative correlation between the proportion of Immigrants from Ethiopia and poverty level among females between the ages 25 and 34 in the United States with a correlation coefficient (R) of -0.196 and weighted average of 12.6%, a difference of 30.1%.
Female Poverty Among 25-34 Year Olds Correlation Summary
| Measurement | Osage | Immigrants from Ethiopia |
| Minimum | 2.4% | 3.3% |
| Maximum | 77.8% | 29.7% |
| Range | 75.3% | 26.4% |
| Mean | 25.2% | 12.6% |
| Median | 21.3% | 11.9% |
| Interquartile 25% (IQ1) | 15.8% | 10.2% |
| Interquartile 75% (IQ3) | 29.3% | 14.4% |
| Interquartile Range (IQR) | 13.5% | 4.1% |
| Standard Deviation (Sample) | 15.1% | 5.1% |
| Standard Deviation (Population) | 14.9% | 5.1% |
Similar Demographics by Female Poverty Among 25-34 Year Olds
Demographics Similar to Osage by Female Poverty Among 25-34 Year Olds
In terms of female poverty among 25-34 year olds, the demographic groups most similar to Osage are Guatemalan (16.4%, a difference of 0.060%), Indonesian (16.4%, a difference of 0.16%), American (16.4%, a difference of 0.25%), Cape Verdean (16.3%, a difference of 0.30%), and Comanche (16.5%, a difference of 0.44%).
| Demographics | Rating | Rank | Female Poverty Among 25-34 Year Olds |
| Aleuts | 0.0 /100 | #282 | Tragic 16.1% |
| Bahamians | 0.0 /100 | #283 | Tragic 16.1% |
| Shoshone | 0.0 /100 | #284 | Tragic 16.2% |
| Immigrants | Bahamas | 0.0 /100 | #285 | Tragic 16.3% |
| Cape Verdeans | 0.0 /100 | #286 | Tragic 16.3% |
| Americans | 0.0 /100 | #287 | Tragic 16.4% |
| Guatemalans | 0.0 /100 | #288 | Tragic 16.4% |
| Osage | 0.0 /100 | #289 | Tragic 16.4% |
| Indonesians | 0.0 /100 | #290 | Tragic 16.4% |
| Comanche | 0.0 /100 | #291 | Tragic 16.5% |
| Immigrants | Dominica | 0.0 /100 | #292 | Tragic 16.5% |
| Potawatomi | 0.0 /100 | #293 | Tragic 16.5% |
| Immigrants | Central America | 0.0 /100 | #294 | Tragic 16.6% |
| Mexicans | 0.0 /100 | #295 | Tragic 16.6% |
| Hispanics or Latinos | 0.0 /100 | #296 | Tragic 16.6% |
Demographics Similar to Immigrants from Ethiopia by Female Poverty Among 25-34 Year Olds
In terms of female poverty among 25-34 year olds, the demographic groups most similar to Immigrants from Ethiopia are Immigrants from Northern Africa (12.6%, a difference of 0.0%), Immigrants from Argentina (12.6%, a difference of 0.11%), Immigrants from Zimbabwe (12.6%, a difference of 0.12%), Ukrainian (12.6%, a difference of 0.13%), and Immigrants from France (12.6%, a difference of 0.17%).
| Demographics | Rating | Rank | Female Poverty Among 25-34 Year Olds |
| Norwegians | 96.9 /100 | #91 | Exceptional 12.6% |
| Immigrants | Armenia | 96.9 /100 | #92 | Exceptional 12.6% |
| Palestinians | 96.9 /100 | #93 | Exceptional 12.6% |
| Immigrants | France | 96.8 /100 | #94 | Exceptional 12.6% |
| Ukrainians | 96.7 /100 | #95 | Exceptional 12.6% |
| Immigrants | Zimbabwe | 96.7 /100 | #96 | Exceptional 12.6% |
| Immigrants | Northern Africa | 96.6 /100 | #97 | Exceptional 12.6% |
| Immigrants | Ethiopia | 96.5 /100 | #98 | Exceptional 12.6% |
| Immigrants | Argentina | 96.4 /100 | #99 | Exceptional 12.6% |
| Immigrants | Denmark | 95.7 /100 | #100 | Exceptional 12.7% |
| Immigrants | Switzerland | 95.7 /100 | #101 | Exceptional 12.7% |
| Peruvians | 95.6 /100 | #102 | Exceptional 12.7% |
| Immigrants | Spain | 95.5 /100 | #103 | Exceptional 12.7% |
| Swedes | 95.4 /100 | #104 | Exceptional 12.7% |
| Immigrants | South Africa | 95.3 /100 | #105 | Exceptional 12.7% |