Osage vs Comanche Median Household Income
COMPARE
Osage
Comanche
Median Household Income
Median Household Income Comparison
Osage
Comanche
$75,240
MEDIAN HOUSEHOLD INCOME
0.2/ 100
METRIC RATING
278th/ 347
METRIC RANK
$73,747
MEDIAN HOUSEHOLD INCOME
0.1/ 100
METRIC RATING
292nd/ 347
METRIC RANK
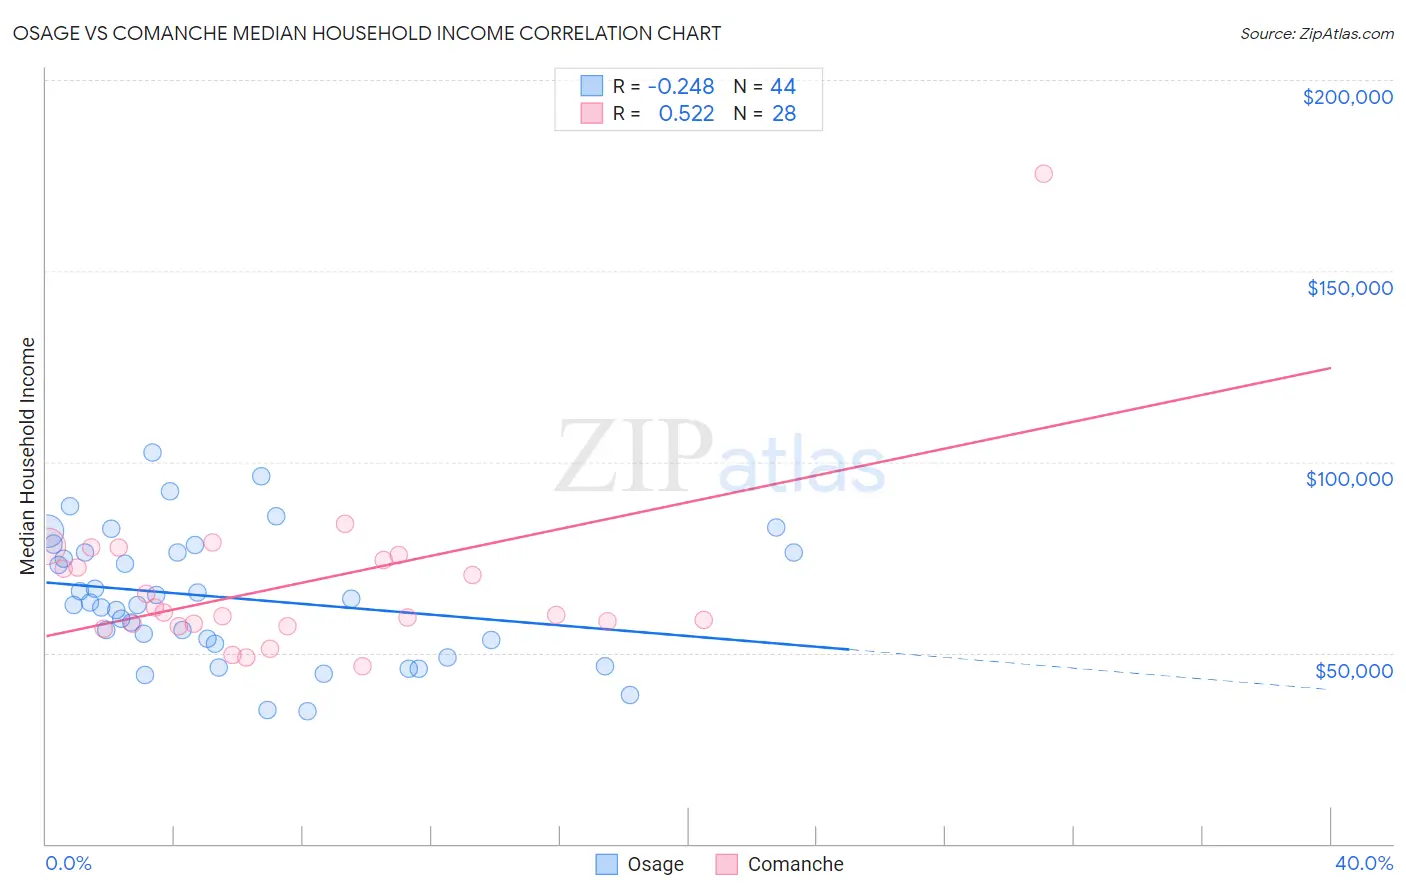
Osage vs Comanche Median Household Income Correlation Chart
The statistical analysis conducted on geographies consisting of 91,796,475 people shows a weak negative correlation between the proportion of Osage and median household income in the United States with a correlation coefficient (R) of -0.248 and weighted average of $75,240. Similarly, the statistical analysis conducted on geographies consisting of 109,755,043 people shows a substantial positive correlation between the proportion of Comanche and median household income in the United States with a correlation coefficient (R) of 0.522 and weighted average of $73,747, a difference of 2.0%.
Median Household Income Correlation Summary
| Measurement | Osage | Comanche |
| Minimum | $34,735 | $46,632 |
| Maximum | $102,379 | $175,595 |
| Range | $67,644 | $128,963 |
| Mean | $64,368 | $67,911 |
| Median | $62,912 | $60,223 |
| Interquartile 25% (IQ1) | $52,984 | $57,248 |
| Interquartile 75% (IQ3) | $76,272 | $74,998 |
| Interquartile Range (IQR) | $23,288 | $17,750 |
| Standard Deviation (Sample) | $16,574 | $23,505 |
| Standard Deviation (Population) | $16,385 | $23,081 |
Demographics Similar to Osage and Comanche by Median Household Income
In terms of median household income, the demographic groups most similar to Osage are Immigrants from Guatemala ($75,123, a difference of 0.16%), Spanish American ($75,386, a difference of 0.19%), Immigrants from Latin America ($75,420, a difference of 0.24%), Senegalese ($74,999, a difference of 0.32%), and Immigrants from Micronesia ($75,574, a difference of 0.44%). Similarly, the demographic groups most similar to Comanche are Hispanic or Latino ($73,823, a difference of 0.10%), Immigrants from Cabo Verde ($73,515, a difference of 0.31%), Blackfeet ($73,509, a difference of 0.32%), Cuban ($73,392, a difference of 0.48%), and Bangladeshi ($74,112, a difference of 0.50%).
| Demographics | Rating | Rank | Median Household Income |
| Immigrants | Micronesia | 0.2 /100 | #275 | Tragic $75,574 |
| Immigrants | Latin America | 0.2 /100 | #276 | Tragic $75,420 |
| Spanish Americans | 0.2 /100 | #277 | Tragic $75,386 |
| Osage | 0.2 /100 | #278 | Tragic $75,240 |
| Immigrants | Guatemala | 0.2 /100 | #279 | Tragic $75,123 |
| Senegalese | 0.2 /100 | #280 | Tragic $74,999 |
| Immigrants | Liberia | 0.1 /100 | #281 | Tragic $74,896 |
| Central American Indians | 0.1 /100 | #282 | Tragic $74,847 |
| Cree | 0.1 /100 | #283 | Tragic $74,685 |
| Yaqui | 0.1 /100 | #284 | Tragic $74,596 |
| Mexicans | 0.1 /100 | #285 | Tragic $74,399 |
| Immigrants | Somalia | 0.1 /100 | #286 | Tragic $74,300 |
| Iroquois | 0.1 /100 | #287 | Tragic $74,279 |
| Immigrants | Central America | 0.1 /100 | #288 | Tragic $74,217 |
| Fijians | 0.1 /100 | #289 | Tragic $74,205 |
| Bangladeshis | 0.1 /100 | #290 | Tragic $74,112 |
| Hispanics or Latinos | 0.1 /100 | #291 | Tragic $73,823 |
| Comanche | 0.1 /100 | #292 | Tragic $73,747 |
| Immigrants | Cabo Verde | 0.1 /100 | #293 | Tragic $73,515 |
| Blackfeet | 0.1 /100 | #294 | Tragic $73,509 |
| Cubans | 0.1 /100 | #295 | Tragic $73,392 |