Okinawan vs Yaqui Median Female Earnings
COMPARE
Okinawan
Yaqui
Median Female Earnings
Median Female Earnings Comparison
Okinawans
Yaqui
$46,905
MEDIAN FEMALE EARNINGS
100.0/ 100
METRIC RATING
11th/ 347
METRIC RANK
$34,943
MEDIAN FEMALE EARNINGS
0.0/ 100
METRIC RATING
312th/ 347
METRIC RANK
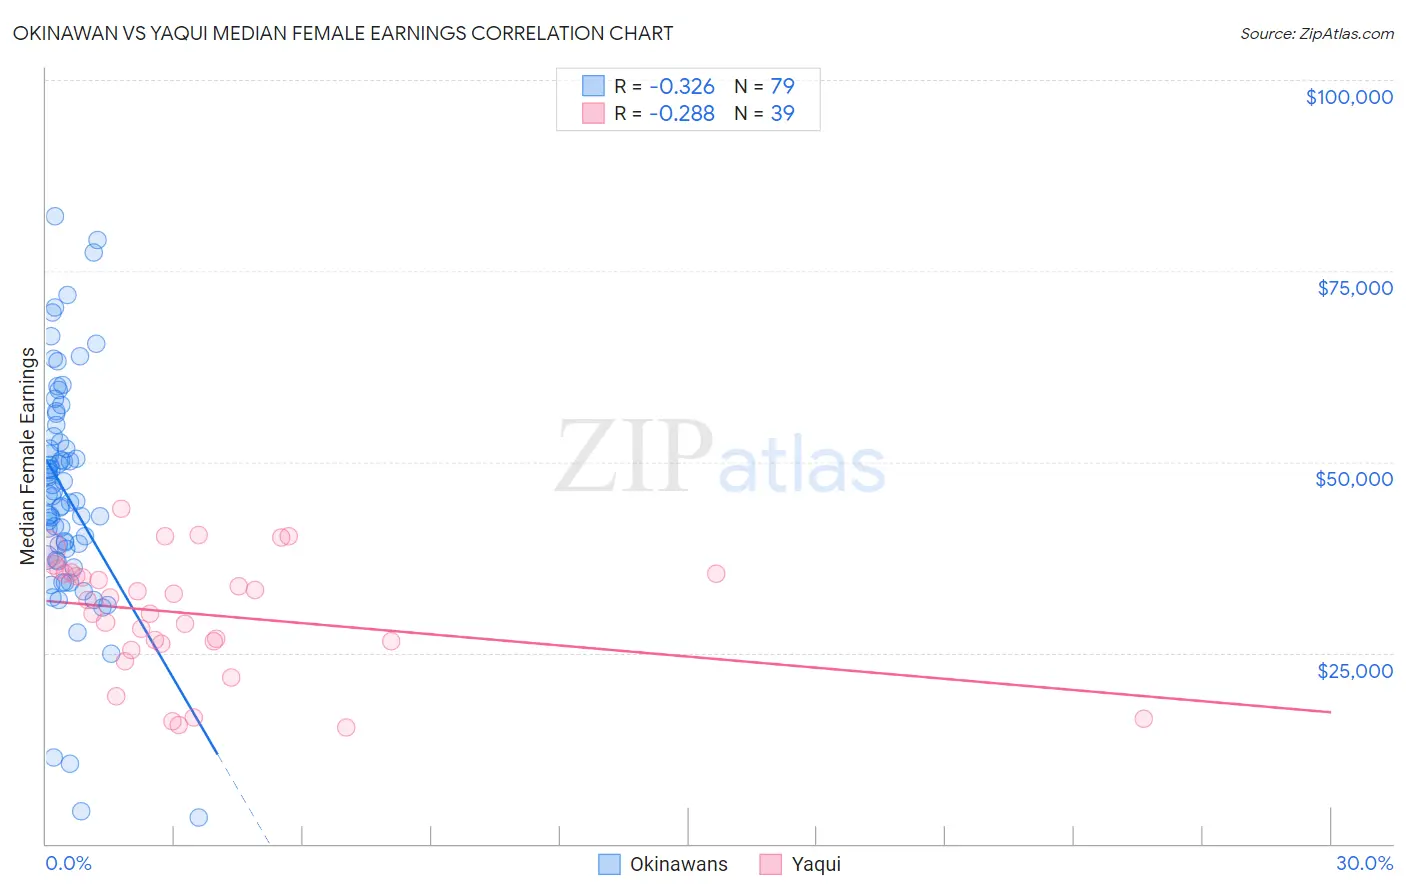
Okinawan vs Yaqui Median Female Earnings Correlation Chart
The statistical analysis conducted on geographies consisting of 73,768,559 people shows a mild negative correlation between the proportion of Okinawans and median female earnings in the United States with a correlation coefficient (R) of -0.326 and weighted average of $46,905. Similarly, the statistical analysis conducted on geographies consisting of 107,698,351 people shows a weak negative correlation between the proportion of Yaqui and median female earnings in the United States with a correlation coefficient (R) of -0.288 and weighted average of $34,943, a difference of 34.2%.
Median Female Earnings Correlation Summary
| Measurement | Okinawan | Yaqui |
| Minimum | $3,494 | $15,284 |
| Maximum | $82,101 | $43,787 |
| Range | $78,607 | $28,503 |
| Mean | $45,866 | $30,052 |
| Median | $45,553 | $31,854 |
| Interquartile 25% (IQ1) | $37,429 | $26,190 |
| Interquartile 75% (IQ3) | $53,420 | $35,336 |
| Interquartile Range (IQR) | $15,991 | $9,146 |
| Standard Deviation (Sample) | $15,052 | $7,719 |
| Standard Deviation (Population) | $14,956 | $7,619 |
Similar Demographics by Median Female Earnings
Demographics Similar to Okinawans by Median Female Earnings
In terms of median female earnings, the demographic groups most similar to Okinawans are Immigrants from Israel ($46,902, a difference of 0.010%), Immigrants from China ($46,972, a difference of 0.14%), Immigrants from Iran ($47,154, a difference of 0.53%), Immigrants from Australia ($46,573, a difference of 0.71%), and Soviet Union ($46,556, a difference of 0.75%).
| Demographics | Rating | Rank | Median Female Earnings |
| Immigrants | India | 100.0 /100 | #4 | Exceptional $48,292 |
| Immigrants | Singapore | 100.0 /100 | #5 | Exceptional $47,986 |
| Immigrants | Ireland | 100.0 /100 | #6 | Exceptional $47,598 |
| Thais | 100.0 /100 | #7 | Exceptional $47,577 |
| Iranians | 100.0 /100 | #8 | Exceptional $47,421 |
| Immigrants | Iran | 100.0 /100 | #9 | Exceptional $47,154 |
| Immigrants | China | 100.0 /100 | #10 | Exceptional $46,972 |
| Okinawans | 100.0 /100 | #11 | Exceptional $46,905 |
| Immigrants | Israel | 100.0 /100 | #12 | Exceptional $46,902 |
| Immigrants | Australia | 100.0 /100 | #13 | Exceptional $46,573 |
| Soviet Union | 100.0 /100 | #14 | Exceptional $46,556 |
| Immigrants | Eastern Asia | 100.0 /100 | #15 | Exceptional $46,502 |
| Indians (Asian) | 100.0 /100 | #16 | Exceptional $46,481 |
| Immigrants | South Central Asia | 100.0 /100 | #17 | Exceptional $46,324 |
| Cypriots | 100.0 /100 | #18 | Exceptional $45,570 |
Demographics Similar to Yaqui by Median Female Earnings
In terms of median female earnings, the demographic groups most similar to Yaqui are Cuban ($34,942, a difference of 0.0%), Ute ($34,960, a difference of 0.050%), Apache ($34,895, a difference of 0.14%), Chippewa ($35,003, a difference of 0.17%), and Honduran ($35,013, a difference of 0.20%).
| Demographics | Rating | Rank | Median Female Earnings |
| Bahamians | 0.0 /100 | #305 | Tragic $35,125 |
| Fijians | 0.0 /100 | #306 | Tragic $35,114 |
| Sioux | 0.0 /100 | #307 | Tragic $35,063 |
| Immigrants | Bahamas | 0.0 /100 | #308 | Tragic $35,027 |
| Hondurans | 0.0 /100 | #309 | Tragic $35,013 |
| Chippewa | 0.0 /100 | #310 | Tragic $35,003 |
| Ute | 0.0 /100 | #311 | Tragic $34,960 |
| Yaqui | 0.0 /100 | #312 | Tragic $34,943 |
| Cubans | 0.0 /100 | #313 | Tragic $34,942 |
| Apache | 0.0 /100 | #314 | Tragic $34,895 |
| Pennsylvania Germans | 0.0 /100 | #315 | Tragic $34,802 |
| Cherokee | 0.0 /100 | #316 | Tragic $34,742 |
| Potawatomi | 0.0 /100 | #317 | Tragic $34,739 |
| Immigrants | Yemen | 0.0 /100 | #318 | Tragic $34,693 |
| Shoshone | 0.0 /100 | #319 | Tragic $34,677 |