Immigrants from Afghanistan vs Sioux Median Earnings
COMPARE
Immigrants from Afghanistan
Sioux
Median Earnings
Median Earnings Comparison
Immigrants from Afghanistan
Sioux
$49,645
MEDIAN EARNINGS
98.9/ 100
METRIC RATING
99th/ 347
METRIC RANK
$39,448
MEDIAN EARNINGS
0.0/ 100
METRIC RATING
328th/ 347
METRIC RANK
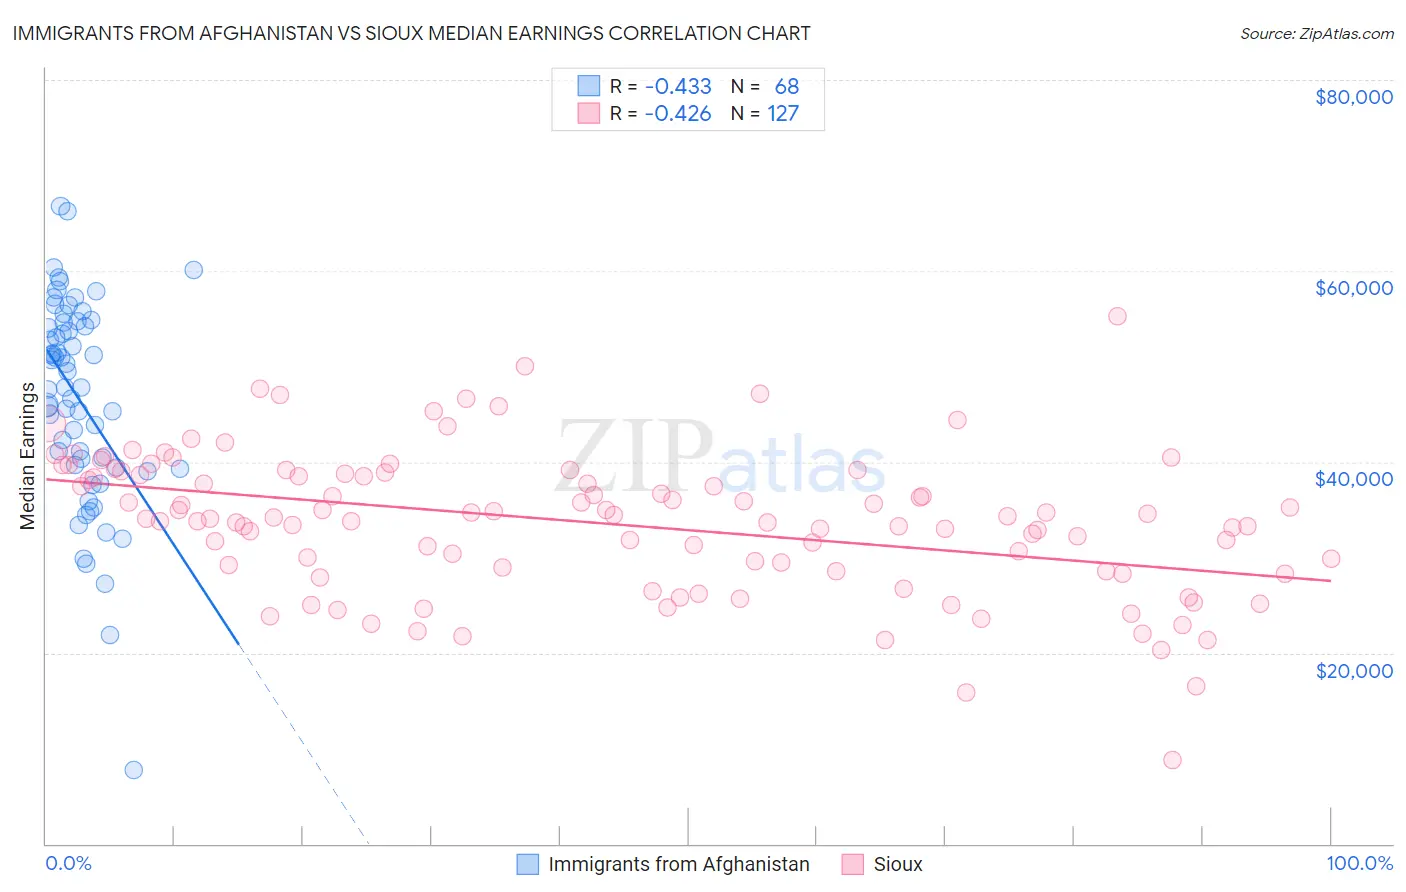
Immigrants from Afghanistan vs Sioux Median Earnings Correlation Chart
The statistical analysis conducted on geographies consisting of 147,645,000 people shows a moderate negative correlation between the proportion of Immigrants from Afghanistan and median earnings in the United States with a correlation coefficient (R) of -0.433 and weighted average of $49,645. Similarly, the statistical analysis conducted on geographies consisting of 234,180,088 people shows a moderate negative correlation between the proportion of Sioux and median earnings in the United States with a correlation coefficient (R) of -0.426 and weighted average of $39,448, a difference of 25.9%.
Median Earnings Correlation Summary
| Measurement | Immigrants from Afghanistan | Sioux |
| Minimum | $7,703 | $8,827 |
| Maximum | $66,757 | $55,313 |
| Range | $59,054 | $46,486 |
| Mean | $46,511 | $33,596 |
| Median | $47,775 | $34,101 |
| Interquartile 25% (IQ1) | $39,495 | $28,589 |
| Interquartile 75% (IQ3) | $54,376 | $38,812 |
| Interquartile Range (IQR) | $14,881 | $10,224 |
| Standard Deviation (Sample) | $10,763 | $7,478 |
| Standard Deviation (Population) | $10,683 | $7,448 |
Similar Demographics by Median Earnings
Demographics Similar to Immigrants from Afghanistan by Median Earnings
In terms of median earnings, the demographic groups most similar to Immigrants from Afghanistan are Immigrants from Northern Africa ($49,648, a difference of 0.010%), Immigrants from Poland ($49,633, a difference of 0.020%), Immigrants from North Macedonia ($49,658, a difference of 0.030%), Jordanian ($49,632, a difference of 0.030%), and Immigrants from Lebanon ($49,682, a difference of 0.070%).
| Demographics | Rating | Rank | Median Earnings |
| Immigrants | Argentina | 99.2 /100 | #92 | Exceptional $49,841 |
| Armenians | 99.1 /100 | #93 | Exceptional $49,804 |
| Croatians | 99.0 /100 | #94 | Exceptional $49,724 |
| Immigrants | England | 99.0 /100 | #95 | Exceptional $49,722 |
| Immigrants | Lebanon | 99.0 /100 | #96 | Exceptional $49,682 |
| Immigrants | North Macedonia | 98.9 /100 | #97 | Exceptional $49,658 |
| Immigrants | Northern Africa | 98.9 /100 | #98 | Exceptional $49,648 |
| Immigrants | Afghanistan | 98.9 /100 | #99 | Exceptional $49,645 |
| Immigrants | Poland | 98.9 /100 | #100 | Exceptional $49,633 |
| Jordanians | 98.9 /100 | #101 | Exceptional $49,632 |
| Ethiopians | 98.8 /100 | #102 | Exceptional $49,572 |
| Austrians | 98.7 /100 | #103 | Exceptional $49,501 |
| Immigrants | Brazil | 98.6 /100 | #104 | Exceptional $49,463 |
| Immigrants | Western Asia | 98.4 /100 | #105 | Exceptional $49,389 |
| Immigrants | Albania | 98.4 /100 | #106 | Exceptional $49,377 |
Demographics Similar to Sioux by Median Earnings
In terms of median earnings, the demographic groups most similar to Sioux are Yuman ($39,523, a difference of 0.19%), Immigrants from Yemen ($39,540, a difference of 0.23%), Creek ($39,648, a difference of 0.51%), Kiowa ($39,232, a difference of 0.55%), and Ottawa ($39,721, a difference of 0.69%).
| Demographics | Rating | Rank | Median Earnings |
| Mexicans | 0.0 /100 | #321 | Tragic $39,834 |
| Immigrants | Central America | 0.0 /100 | #322 | Tragic $39,762 |
| Bahamians | 0.0 /100 | #323 | Tragic $39,735 |
| Ottawa | 0.0 /100 | #324 | Tragic $39,721 |
| Creek | 0.0 /100 | #325 | Tragic $39,648 |
| Immigrants | Yemen | 0.0 /100 | #326 | Tragic $39,540 |
| Yuman | 0.0 /100 | #327 | Tragic $39,523 |
| Sioux | 0.0 /100 | #328 | Tragic $39,448 |
| Kiowa | 0.0 /100 | #329 | Tragic $39,232 |
| Immigrants | Congo | 0.0 /100 | #330 | Tragic $39,169 |
| Immigrants | Mexico | 0.0 /100 | #331 | Tragic $39,114 |
| Yakama | 0.0 /100 | #332 | Tragic $39,107 |
| Houma | 0.0 /100 | #333 | Tragic $38,949 |
| Spanish American Indians | 0.0 /100 | #334 | Tragic $38,907 |
| Natives/Alaskans | 0.0 /100 | #335 | Tragic $38,896 |