Kiowa vs Delaware Median Household Income
COMPARE
Kiowa
Delaware
Median Household Income
Median Household Income Comparison
Kiowa
Delaware
$65,914
MEDIAN HOUSEHOLD INCOME
0.0/ 100
METRIC RATING
337th/ 347
METRIC RANK
$80,527
MEDIAN HOUSEHOLD INCOME
5.0/ 100
METRIC RATING
229th/ 347
METRIC RANK
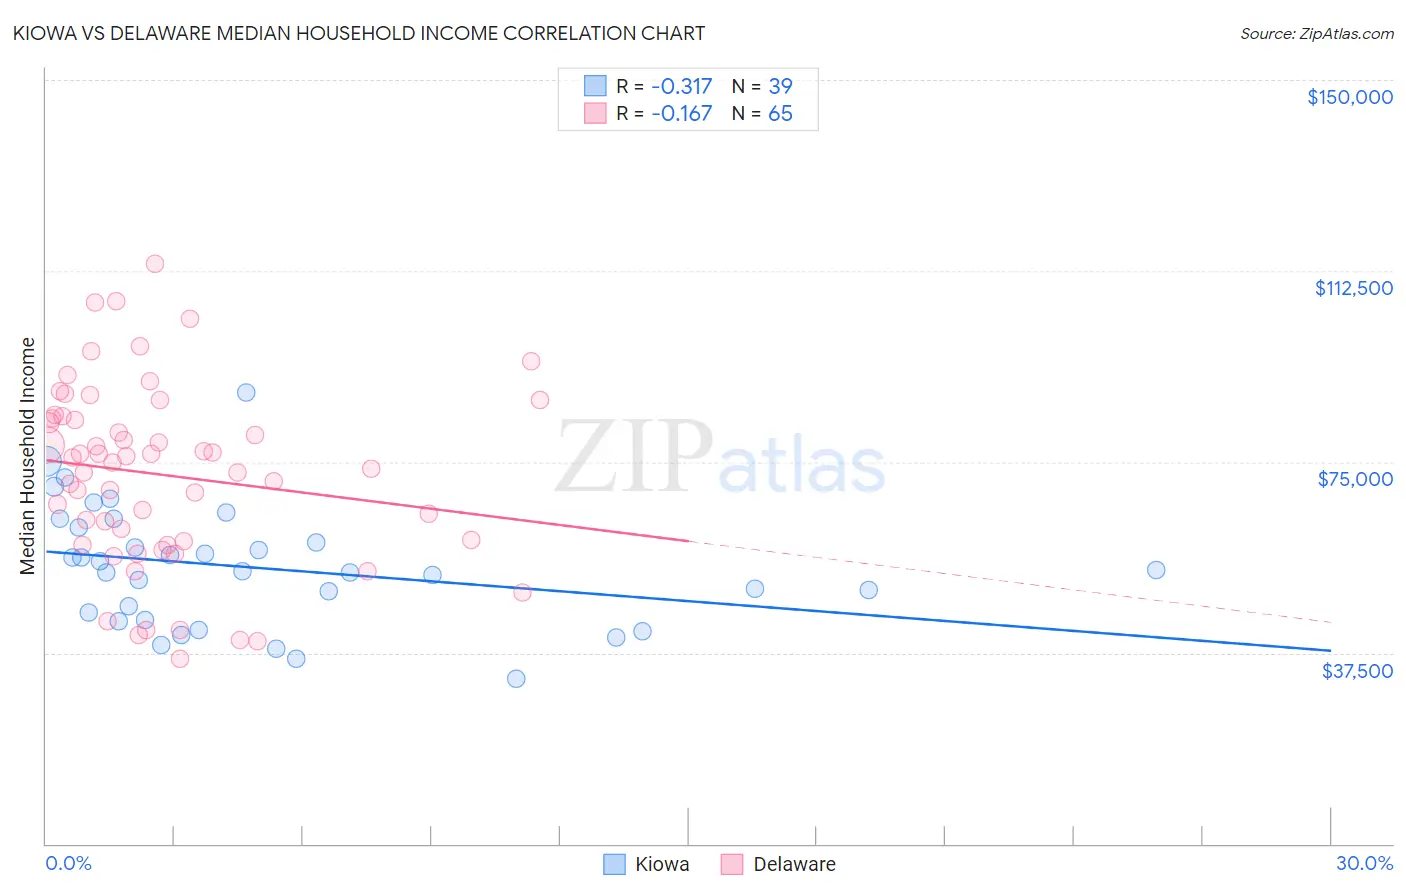
Kiowa vs Delaware Median Household Income Correlation Chart
The statistical analysis conducted on geographies consisting of 56,098,760 people shows a mild negative correlation between the proportion of Kiowa and median household income in the United States with a correlation coefficient (R) of -0.317 and weighted average of $65,914. Similarly, the statistical analysis conducted on geographies consisting of 96,222,020 people shows a poor negative correlation between the proportion of Delaware and median household income in the United States with a correlation coefficient (R) of -0.167 and weighted average of $80,527, a difference of 22.2%.
Median Household Income Correlation Summary
| Measurement | Kiowa | Delaware |
| Minimum | $32,500 | $36,250 |
| Maximum | $88,558 | $113,889 |
| Range | $56,058 | $77,639 |
| Mean | $54,131 | $72,395 |
| Median | $53,438 | $74,896 |
| Interquartile 25% (IQ1) | $43,977 | $59,089 |
| Interquartile 75% (IQ3) | $62,181 | $83,725 |
| Interquartile Range (IQR) | $18,204 | $24,635 |
| Standard Deviation (Sample) | $11,836 | $17,722 |
| Standard Deviation (Population) | $11,684 | $17,585 |
Similar Demographics by Median Household Income
Demographics Similar to Kiowa by Median Household Income
In terms of median household income, the demographic groups most similar to Kiowa are Immigrants from Yemen ($65,194, a difference of 1.1%), Immigrants from Congo ($66,768, a difference of 1.3%), Hopi ($65,043, a difference of 1.3%), Cheyenne ($66,974, a difference of 1.6%), and Pueblo ($64,692, a difference of 1.9%).
| Demographics | Rating | Rank | Median Household Income |
| Arapaho | 0.0 /100 | #330 | Tragic $67,965 |
| Natives/Alaskans | 0.0 /100 | #331 | Tragic $67,879 |
| Sioux | 0.0 /100 | #332 | Tragic $67,792 |
| Creek | 0.0 /100 | #333 | Tragic $67,715 |
| Blacks/African Americans | 0.0 /100 | #334 | Tragic $67,573 |
| Cheyenne | 0.0 /100 | #335 | Tragic $66,974 |
| Immigrants | Congo | 0.0 /100 | #336 | Tragic $66,768 |
| Kiowa | 0.0 /100 | #337 | Tragic $65,914 |
| Immigrants | Yemen | 0.0 /100 | #338 | Tragic $65,194 |
| Hopi | 0.0 /100 | #339 | Tragic $65,043 |
| Pueblo | 0.0 /100 | #340 | Tragic $64,692 |
| Crow | 0.0 /100 | #341 | Tragic $63,681 |
| Pima | 0.0 /100 | #342 | Tragic $63,262 |
| Houma | 0.0 /100 | #343 | Tragic $62,575 |
| Tohono O'odham | 0.0 /100 | #344 | Tragic $61,663 |
Demographics Similar to Delaware by Median Household Income
In terms of median household income, the demographic groups most similar to Delaware are Bermudan ($80,406, a difference of 0.15%), Trinidadian and Tobagonian ($80,402, a difference of 0.16%), Immigrants from Trinidad and Tobago ($80,373, a difference of 0.19%), Immigrants from the Azores ($80,357, a difference of 0.21%), and Immigrants from Ecuador ($80,341, a difference of 0.23%).
| Demographics | Rating | Rank | Median Household Income |
| Immigrants | Nigeria | 7.7 /100 | #222 | Tragic $81,236 |
| Immigrants | El Salvador | 7.6 /100 | #223 | Tragic $81,213 |
| Malaysians | 7.0 /100 | #224 | Tragic $81,064 |
| Scotch-Irish | 6.6 /100 | #225 | Tragic $80,972 |
| Immigrants | Panama | 6.2 /100 | #226 | Tragic $80,873 |
| Guyanese | 5.7 /100 | #227 | Tragic $80,734 |
| Immigrants | Bangladesh | 5.7 /100 | #228 | Tragic $80,722 |
| Delaware | 5.0 /100 | #229 | Tragic $80,527 |
| Bermudans | 4.7 /100 | #230 | Tragic $80,406 |
| Trinidadians and Tobagonians | 4.7 /100 | #231 | Tragic $80,402 |
| Immigrants | Trinidad and Tobago | 4.6 /100 | #232 | Tragic $80,373 |
| Immigrants | Azores | 4.5 /100 | #233 | Tragic $80,357 |
| Immigrants | Ecuador | 4.5 /100 | #234 | Tragic $80,341 |
| Immigrants | Guyana | 4.5 /100 | #235 | Tragic $80,324 |
| Immigrants | Bosnia and Herzegovina | 3.4 /100 | #236 | Tragic $79,888 |