Immigrants from Trinidad and Tobago vs Immigrants from Canada Per Capita Income
COMPARE
Immigrants from Trinidad and Tobago
Immigrants from Canada
Per Capita Income
Per Capita Income Comparison
Immigrants from Trinidad and Tobago
Immigrants from Canada
$41,476
PER CAPITA INCOME
7.9/ 100
METRIC RATING
221st/ 347
METRIC RANK
$49,412
PER CAPITA INCOME
99.8/ 100
METRIC RATING
69th/ 347
METRIC RANK
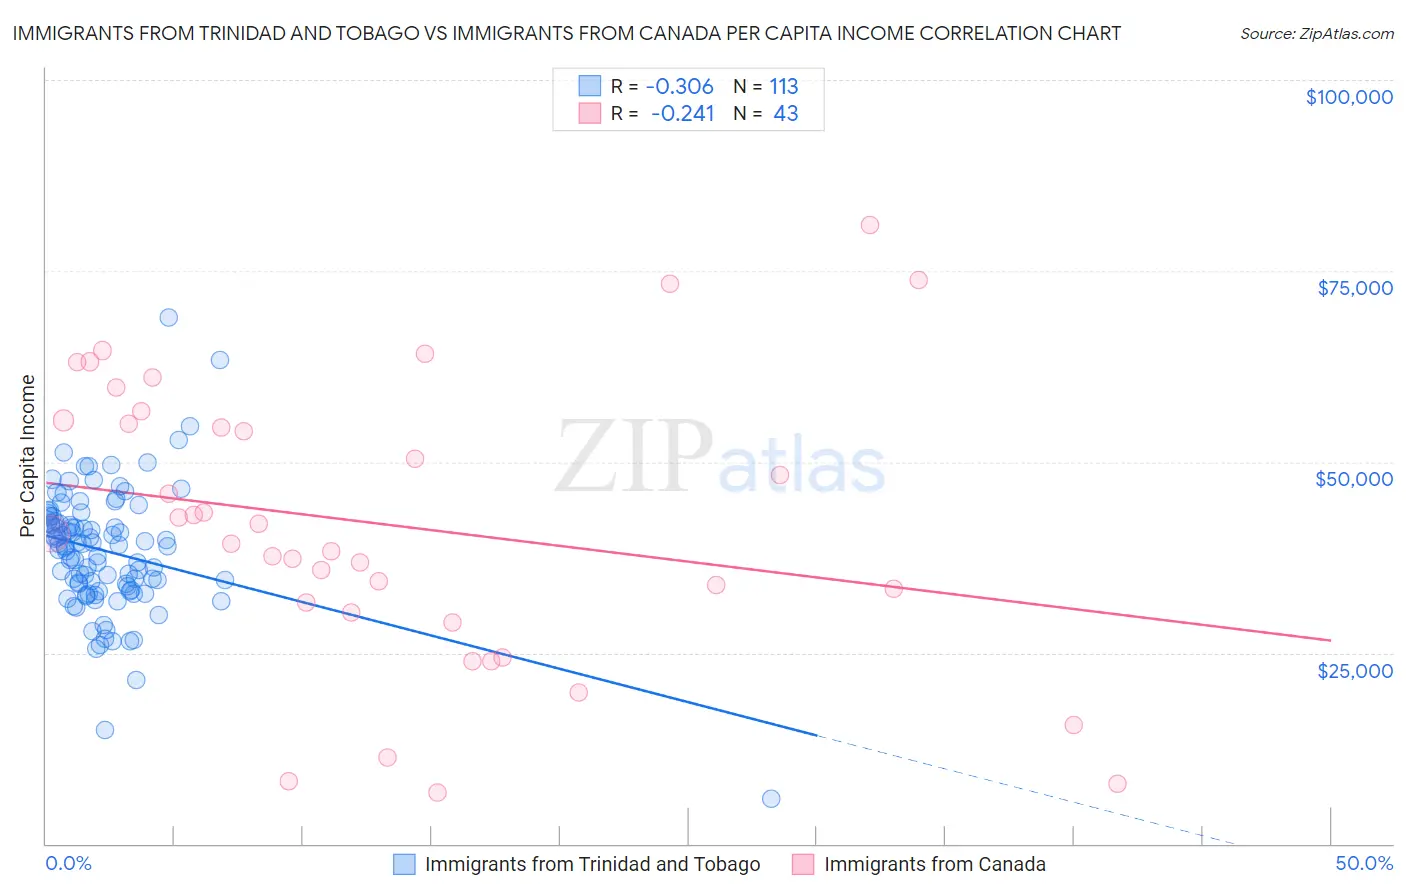
Immigrants from Trinidad and Tobago vs Immigrants from Canada Per Capita Income Correlation Chart
The statistical analysis conducted on geographies consisting of 223,544,237 people shows a mild negative correlation between the proportion of Immigrants from Trinidad and Tobago and per capita income in the United States with a correlation coefficient (R) of -0.306 and weighted average of $41,476. Similarly, the statistical analysis conducted on geographies consisting of 459,409,712 people shows a weak negative correlation between the proportion of Immigrants from Canada and per capita income in the United States with a correlation coefficient (R) of -0.241 and weighted average of $49,412, a difference of 19.1%.
Per Capita Income Correlation Summary
| Measurement | Immigrants from Trinidad and Tobago | Immigrants from Canada |
| Minimum | $5,914 | $6,700 |
| Maximum | $68,888 | $80,940 |
| Range | $62,974 | $74,240 |
| Mean | $38,326 | $41,746 |
| Median | $38,965 | $40,519 |
| Interquartile 25% (IQ1) | $33,457 | $30,302 |
| Interquartile 75% (IQ3) | $42,576 | $55,434 |
| Interquartile Range (IQR) | $9,119 | $25,132 |
| Standard Deviation (Sample) | $8,310 | $18,564 |
| Standard Deviation (Population) | $8,273 | $18,346 |
Similar Demographics by Per Capita Income
Demographics Similar to Immigrants from Trinidad and Tobago by Per Capita Income
In terms of per capita income, the demographic groups most similar to Immigrants from Trinidad and Tobago are Immigrants from Barbados ($41,478, a difference of 0.0%), Puget Sound Salish ($41,495, a difference of 0.040%), Immigrants from Iraq ($41,365, a difference of 0.27%), Immigrants from Cameroon ($41,334, a difference of 0.34%), and Trinidadian and Tobagonian ($41,655, a difference of 0.43%).
| Demographics | Rating | Rank | Per Capita Income |
| Immigrants | Bangladesh | 10.1 /100 | #214 | Poor $41,709 |
| Sudanese | 9.9 /100 | #215 | Tragic $41,695 |
| Tongans | 9.9 /100 | #216 | Tragic $41,693 |
| Guamanians/Chamorros | 9.7 /100 | #217 | Tragic $41,678 |
| Trinidadians and Tobagonians | 9.5 /100 | #218 | Tragic $41,655 |
| Puget Sound Salish | 8.1 /100 | #219 | Tragic $41,495 |
| Immigrants | Barbados | 7.9 /100 | #220 | Tragic $41,478 |
| Immigrants | Trinidad and Tobago | 7.9 /100 | #221 | Tragic $41,476 |
| Immigrants | Iraq | 7.1 /100 | #222 | Tragic $41,365 |
| Immigrants | Cameroon | 6.8 /100 | #223 | Tragic $41,334 |
| Immigrants | St. Vincent and the Grenadines | 6.4 /100 | #224 | Tragic $41,270 |
| West Indians | 6.0 /100 | #225 | Tragic $41,217 |
| Immigrants | Ecuador | 5.9 /100 | #226 | Tragic $41,195 |
| Immigrants | Ghana | 5.5 /100 | #227 | Tragic $41,131 |
| Immigrants | Grenada | 5.5 /100 | #228 | Tragic $41,123 |
Demographics Similar to Immigrants from Canada by Per Capita Income
In terms of per capita income, the demographic groups most similar to Immigrants from Canada are Lithuanian ($49,448, a difference of 0.070%), Immigrants from Romania ($49,463, a difference of 0.10%), Immigrants from Bulgaria ($49,482, a difference of 0.14%), Immigrants from Eastern Europe ($49,316, a difference of 0.20%), and Greek ($49,309, a difference of 0.21%).
| Demographics | Rating | Rank | Per Capita Income |
| Immigrants | Asia | 99.9 /100 | #62 | Exceptional $49,741 |
| Maltese | 99.9 /100 | #63 | Exceptional $49,640 |
| Immigrants | Argentina | 99.9 /100 | #64 | Exceptional $49,627 |
| Bolivians | 99.9 /100 | #65 | Exceptional $49,526 |
| Immigrants | Bulgaria | 99.9 /100 | #66 | Exceptional $49,482 |
| Immigrants | Romania | 99.9 /100 | #67 | Exceptional $49,463 |
| Lithuanians | 99.8 /100 | #68 | Exceptional $49,448 |
| Immigrants | Canada | 99.8 /100 | #69 | Exceptional $49,412 |
| Immigrants | Eastern Europe | 99.8 /100 | #70 | Exceptional $49,316 |
| Greeks | 99.8 /100 | #71 | Exceptional $49,309 |
| Immigrants | Hungary | 99.8 /100 | #72 | Exceptional $49,303 |
| Immigrants | North America | 99.8 /100 | #73 | Exceptional $49,302 |
| Mongolians | 99.8 /100 | #74 | Exceptional $49,173 |
| Immigrants | Bolivia | 99.7 /100 | #75 | Exceptional $48,970 |
| Immigrants | England | 99.7 /100 | #76 | Exceptional $48,844 |