Northern European vs Irish Median Female Earnings
COMPARE
Northern European
Irish
Median Female Earnings
Median Female Earnings Comparison
Northern Europeans
Irish
$40,491
MEDIAN FEMALE EARNINGS
83.9/ 100
METRIC RATING
143rd/ 347
METRIC RANK
$39,291
MEDIAN FEMALE EARNINGS
30.0/ 100
METRIC RATING
194th/ 347
METRIC RANK
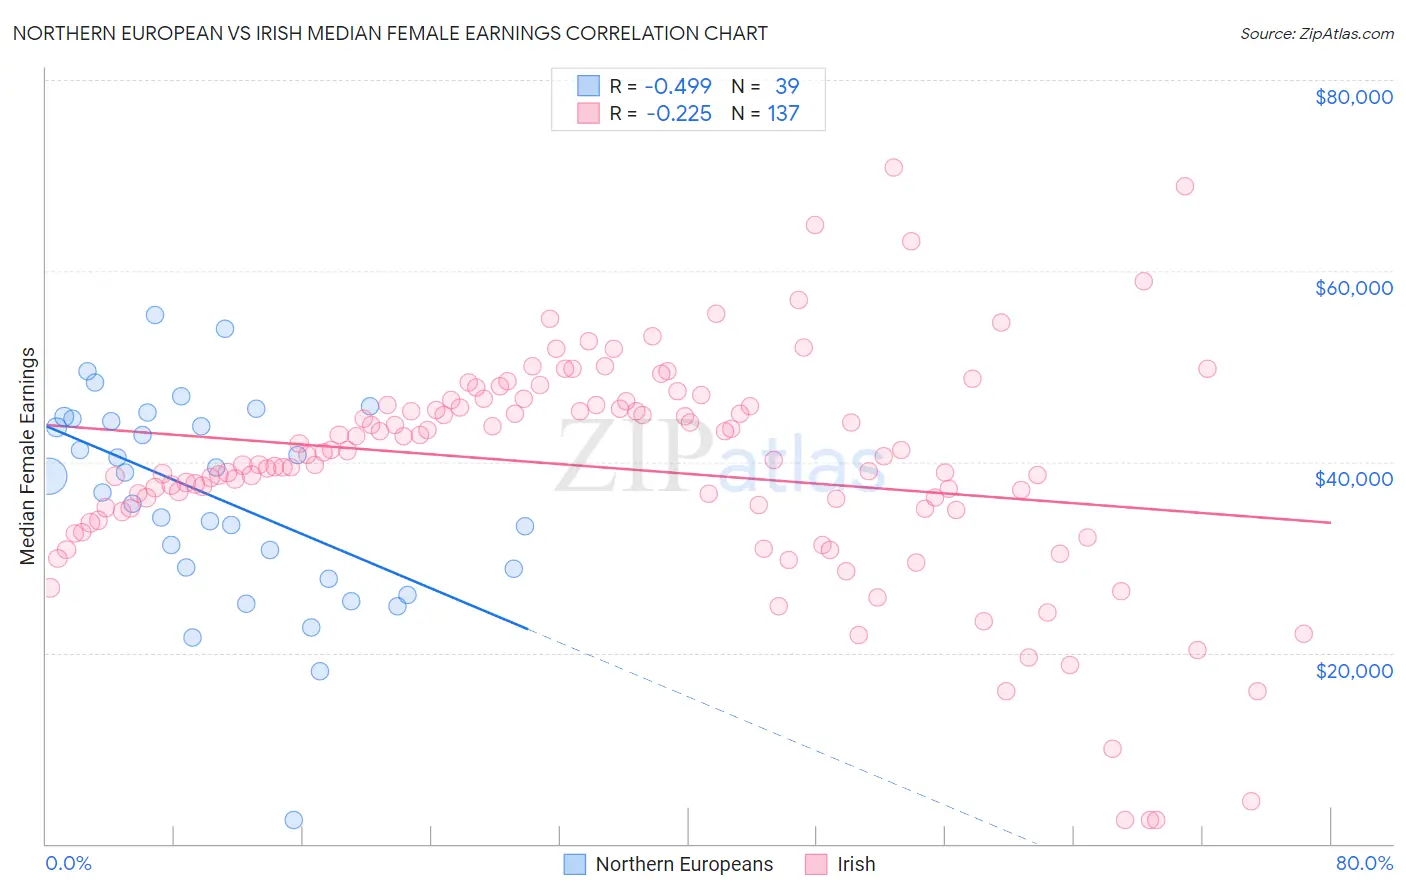
Northern European vs Irish Median Female Earnings Correlation Chart
The statistical analysis conducted on geographies consisting of 405,763,139 people shows a moderate negative correlation between the proportion of Northern Europeans and median female earnings in the United States with a correlation coefficient (R) of -0.499 and weighted average of $40,491. Similarly, the statistical analysis conducted on geographies consisting of 577,855,613 people shows a weak negative correlation between the proportion of Irish and median female earnings in the United States with a correlation coefficient (R) of -0.225 and weighted average of $39,291, a difference of 3.1%.
Median Female Earnings Correlation Summary
| Measurement | Northern European | Irish |
| Minimum | $2,499 | $2,499 |
| Maximum | $55,429 | $70,827 |
| Range | $52,930 | $68,328 |
| Mean | $36,265 | $39,404 |
| Median | $38,502 | $40,229 |
| Interquartile 25% (IQ1) | $28,750 | $35,070 |
| Interquartile 75% (IQ3) | $44,474 | $45,938 |
| Interquartile Range (IQR) | $15,724 | $10,868 |
| Standard Deviation (Sample) | $10,785 | $11,843 |
| Standard Deviation (Population) | $10,645 | $11,799 |
Similar Demographics by Median Female Earnings
Demographics Similar to Northern Europeans by Median Female Earnings
In terms of median female earnings, the demographic groups most similar to Northern Europeans are Sri Lankan ($40,496, a difference of 0.010%), Immigrants from North Macedonia ($40,488, a difference of 0.010%), Immigrants from Syria ($40,499, a difference of 0.020%), Brazilian ($40,483, a difference of 0.020%), and Serbian ($40,539, a difference of 0.12%).
| Demographics | Rating | Rank | Median Female Earnings |
| Immigrants | Eastern Africa | 87.7 /100 | #136 | Excellent $40,644 |
| Pakistanis | 86.6 /100 | #137 | Excellent $40,596 |
| Taiwanese | 86.1 /100 | #138 | Excellent $40,576 |
| Immigrants | South Eastern Asia | 85.7 /100 | #139 | Excellent $40,558 |
| Serbians | 85.2 /100 | #140 | Excellent $40,539 |
| Immigrants | Syria | 84.1 /100 | #141 | Excellent $40,499 |
| Sri Lankans | 84.0 /100 | #142 | Excellent $40,496 |
| Northern Europeans | 83.9 /100 | #143 | Excellent $40,491 |
| Immigrants | North Macedonia | 83.8 /100 | #144 | Excellent $40,488 |
| Brazilians | 83.6 /100 | #145 | Excellent $40,483 |
| Ghanaians | 82.1 /100 | #146 | Excellent $40,429 |
| Vietnamese | 80.4 /100 | #147 | Excellent $40,377 |
| Poles | 80.2 /100 | #148 | Excellent $40,371 |
| Immigrants | Cameroon | 79.7 /100 | #149 | Good $40,354 |
| Immigrants | Chile | 79.6 /100 | #150 | Good $40,353 |
Demographics Similar to Irish by Median Female Earnings
In terms of median female earnings, the demographic groups most similar to Irish are Immigrants from Nigeria ($39,294, a difference of 0.010%), Immigrants ($39,328, a difference of 0.090%), Immigrants from Western Africa ($39,351, a difference of 0.15%), Uruguayan ($39,228, a difference of 0.16%), and Puget Sound Salish ($39,376, a difference of 0.22%).
| Demographics | Rating | Rank | Median Female Earnings |
| Swedes | 36.0 /100 | #187 | Fair $39,421 |
| Bermudans | 35.9 /100 | #188 | Fair $39,418 |
| Senegalese | 34.2 /100 | #189 | Fair $39,384 |
| Puget Sound Salish | 33.9 /100 | #190 | Fair $39,376 |
| Immigrants | Western Africa | 32.7 /100 | #191 | Fair $39,351 |
| Immigrants | Immigrants | 31.7 /100 | #192 | Fair $39,328 |
| Immigrants | Nigeria | 30.2 /100 | #193 | Fair $39,294 |
| Irish | 30.0 /100 | #194 | Fair $39,291 |
| Uruguayans | 27.3 /100 | #195 | Fair $39,228 |
| Immigrants | Costa Rica | 25.6 /100 | #196 | Fair $39,186 |
| Assyrians/Chaldeans/Syriacs | 24.6 /100 | #197 | Fair $39,159 |
| Ecuadorians | 23.0 /100 | #198 | Fair $39,117 |
| Icelanders | 22.7 /100 | #199 | Fair $39,109 |
| Immigrants | Panama | 20.6 /100 | #200 | Fair $39,049 |
| Panamanians | 20.6 /100 | #201 | Fair $39,049 |