Nigerian vs Venezuelan Householder Income Ages 25 - 44 years
COMPARE
Nigerian
Venezuelan
Householder Income Ages 25 - 44 years
Householder Income Ages 25 - 44 years Comparison
Nigerians
Venezuelans
$87,730
HOUSEHOLDER INCOME AGES 25 - 44 YEARS
2.2/ 100
METRIC RATING
241st/ 347
METRIC RANK
$88,232
HOUSEHOLDER INCOME AGES 25 - 44 YEARS
2.9/ 100
METRIC RATING
234th/ 347
METRIC RANK
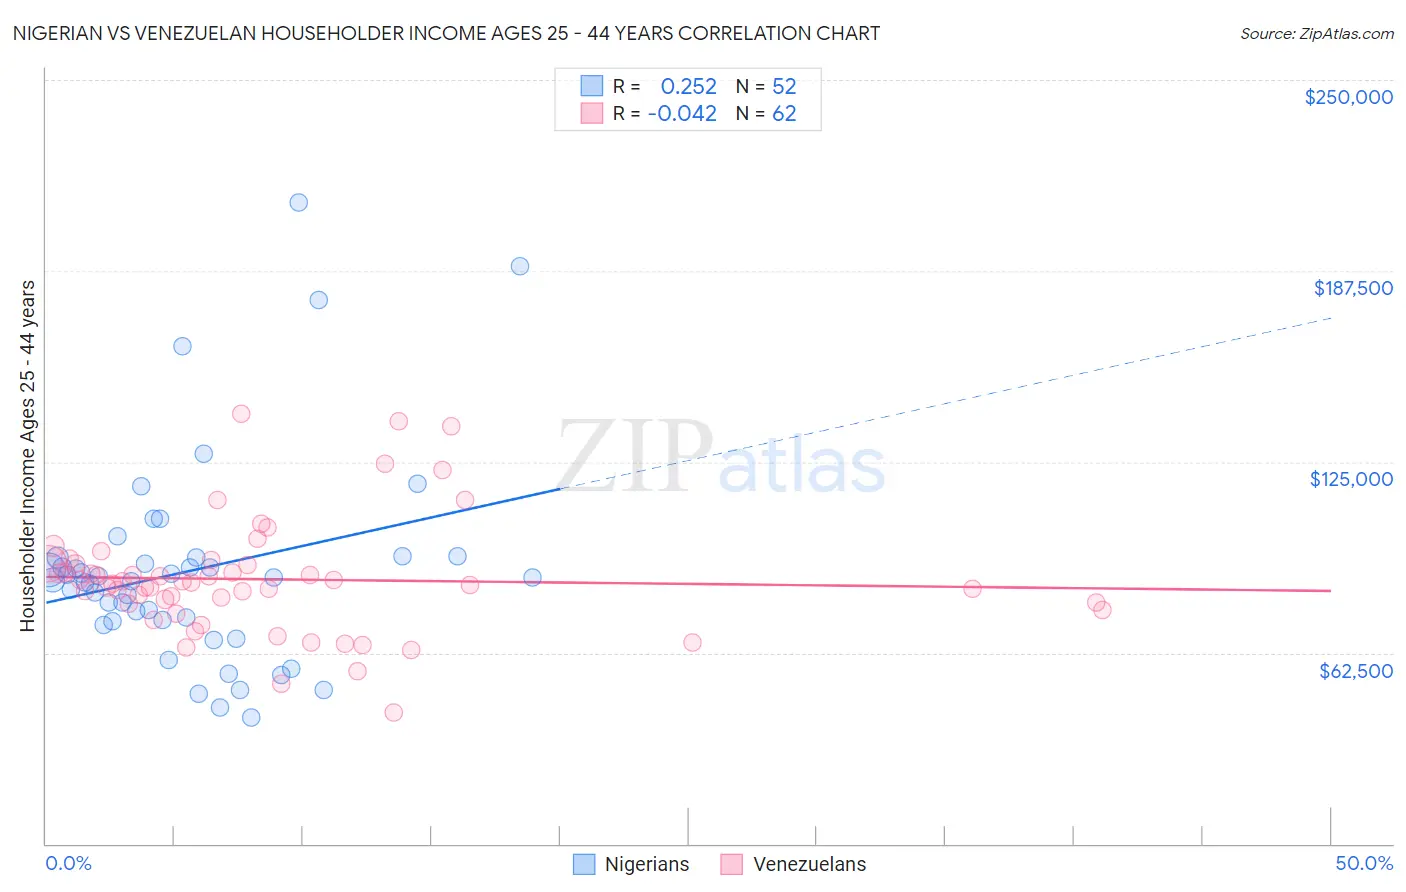
Nigerian vs Venezuelan Householder Income Ages 25 - 44 years Correlation Chart
The statistical analysis conducted on geographies consisting of 332,006,282 people shows a weak positive correlation between the proportion of Nigerians and household income with householder between the ages 25 and 44 in the United States with a correlation coefficient (R) of 0.252 and weighted average of $87,730. Similarly, the statistical analysis conducted on geographies consisting of 305,747,877 people shows no correlation between the proportion of Venezuelans and household income with householder between the ages 25 and 44 in the United States with a correlation coefficient (R) of -0.042 and weighted average of $88,232, a difference of 0.57%.
Householder Income Ages 25 - 44 years Correlation Summary
| Measurement | Nigerian | Venezuelan |
| Minimum | $41,500 | $42,793 |
| Maximum | $210,089 | $140,677 |
| Range | $168,589 | $97,884 |
| Mean | $89,439 | $86,559 |
| Median | $86,690 | $85,482 |
| Interquartile 25% (IQ1) | $73,174 | $78,670 |
| Interquartile 75% (IQ3) | $93,591 | $91,500 |
| Interquartile Range (IQR) | $20,417 | $12,831 |
| Standard Deviation (Sample) | $33,605 | $18,862 |
| Standard Deviation (Population) | $33,281 | $18,709 |
Demographics Similar to Nigerians and Venezuelans by Householder Income Ages 25 - 44 years
In terms of householder income ages 25 - 44 years, the demographic groups most similar to Nigerians are Nicaraguan ($87,751, a difference of 0.020%), Immigrants from Ghana ($87,760, a difference of 0.030%), Alaska Native ($88,018, a difference of 0.33%), Salvadoran ($88,198, a difference of 0.53%), and Immigrants from Cameroon ($88,214, a difference of 0.55%). Similarly, the demographic groups most similar to Venezuelans are Bermudan ($88,231, a difference of 0.0%), Immigrants from Cameroon ($88,214, a difference of 0.020%), Salvadoran ($88,198, a difference of 0.040%), Malaysian ($88,291, a difference of 0.070%), and Nonimmigrants ($88,301, a difference of 0.080%).
| Demographics | Rating | Rank | Householder Income Ages 25 - 44 years |
| Immigrants | St. Vincent and the Grenadines | 4.1 /100 | #227 | Tragic $88,888 |
| Immigrants | Bosnia and Herzegovina | 4.0 /100 | #228 | Tragic $88,819 |
| Immigrants | Barbados | 3.7 /100 | #229 | Tragic $88,687 |
| Alaskan Athabascans | 3.3 /100 | #230 | Tragic $88,446 |
| Immigrants | Grenada | 3.0 /100 | #231 | Tragic $88,311 |
| Immigrants | Nonimmigrants | 3.0 /100 | #232 | Tragic $88,301 |
| Malaysians | 3.0 /100 | #233 | Tragic $88,291 |
| Venezuelans | 2.9 /100 | #234 | Tragic $88,232 |
| Bermudans | 2.9 /100 | #235 | Tragic $88,231 |
| Immigrants | Cameroon | 2.9 /100 | #236 | Tragic $88,214 |
| Salvadorans | 2.8 /100 | #237 | Tragic $88,198 |
| Alaska Natives | 2.6 /100 | #238 | Tragic $88,018 |
| Immigrants | Ghana | 2.2 /100 | #239 | Tragic $87,760 |
| Nicaraguans | 2.2 /100 | #240 | Tragic $87,751 |
| Nigerians | 2.2 /100 | #241 | Tragic $87,730 |
| West Indians | 1.7 /100 | #242 | Tragic $87,205 |
| Immigrants | West Indies | 1.5 /100 | #243 | Tragic $87,063 |
| Immigrants | Venezuela | 1.5 /100 | #244 | Tragic $87,038 |
| Immigrants | El Salvador | 1.4 /100 | #245 | Tragic $86,913 |
| Immigrants | Burma/Myanmar | 1.3 /100 | #246 | Tragic $86,736 |
| Immigrants | Nigeria | 1.2 /100 | #247 | Tragic $86,589 |