New Zealander vs Immigrants from South Central Asia Median Family Income
COMPARE
New Zealander
Immigrants from South Central Asia
Median Family Income
Median Family Income Comparison
New Zealanders
Immigrants from South Central Asia
$115,230
MEDIAN FAMILY INCOME
99.8/ 100
METRIC RATING
56th/ 347
METRIC RANK
$125,956
MEDIAN FAMILY INCOME
100.0/ 100
METRIC RATING
14th/ 347
METRIC RANK
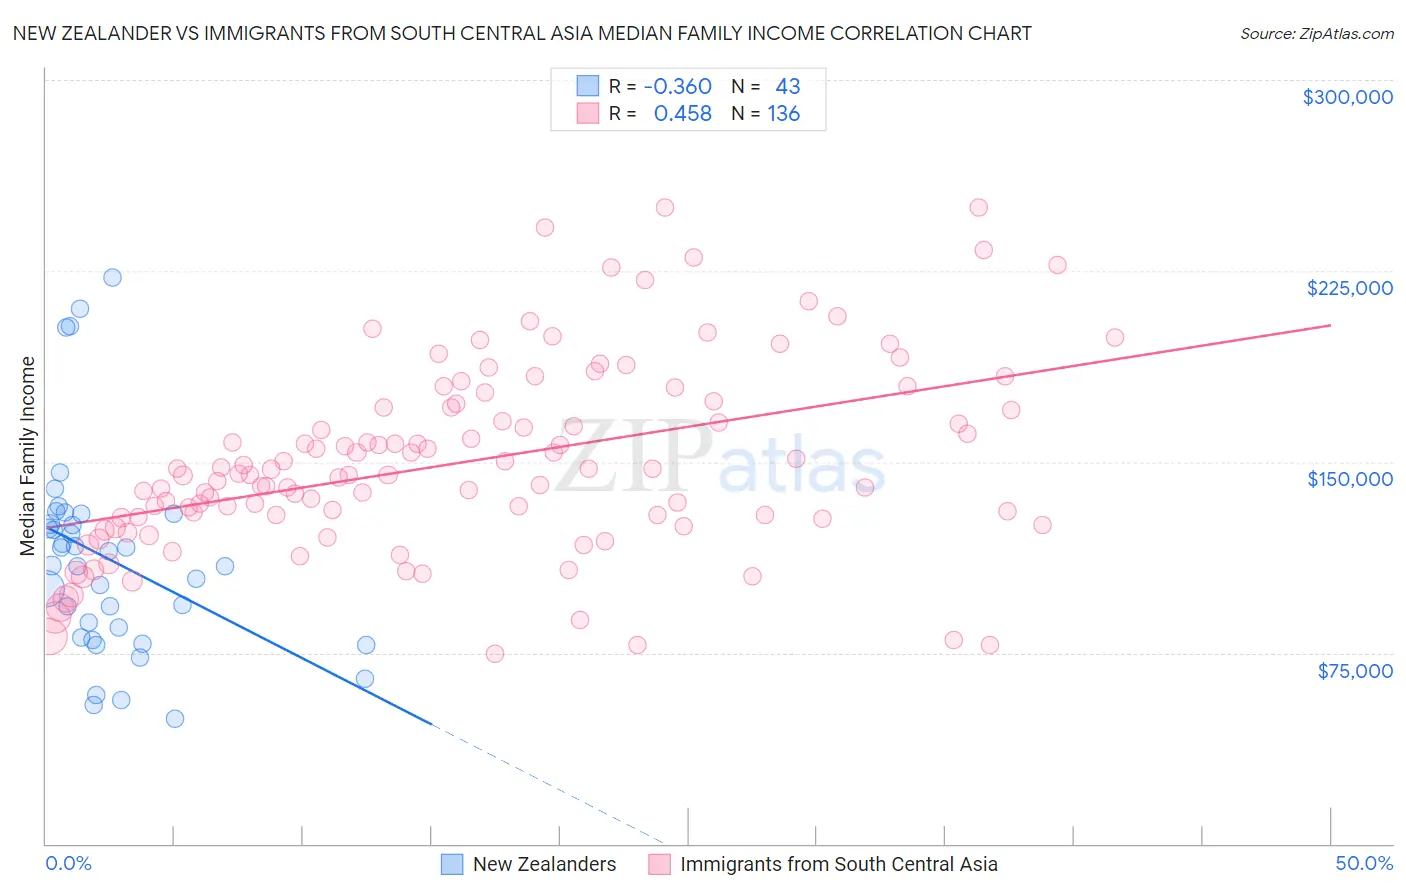
New Zealander vs Immigrants from South Central Asia Median Family Income Correlation Chart
The statistical analysis conducted on geographies consisting of 106,887,889 people shows a mild negative correlation between the proportion of New Zealanders and median family income in the United States with a correlation coefficient (R) of -0.360 and weighted average of $115,230. Similarly, the statistical analysis conducted on geographies consisting of 472,438,765 people shows a moderate positive correlation between the proportion of Immigrants from South Central Asia and median family income in the United States with a correlation coefficient (R) of 0.458 and weighted average of $125,956, a difference of 9.3%.
Median Family Income Correlation Summary
| Measurement | New Zealander | Immigrants from South Central Asia |
| Minimum | $49,107 | $74,415 |
| Maximum | $222,283 | $250,001 |
| Range | $173,176 | $175,586 |
| Mean | $111,963 | $149,714 |
| Median | $109,262 | $145,025 |
| Interquartile 25% (IQ1) | $80,824 | $127,772 |
| Interquartile 75% (IQ3) | $129,386 | $171,402 |
| Interquartile Range (IQR) | $48,562 | $43,630 |
| Standard Deviation (Sample) | $40,212 | $37,158 |
| Standard Deviation (Population) | $39,742 | $37,021 |
Similar Demographics by Median Family Income
Demographics Similar to New Zealanders by Median Family Income
In terms of median family income, the demographic groups most similar to New Zealanders are Greek ($115,192, a difference of 0.030%), Immigrants from Indonesia ($115,162, a difference of 0.060%), Lithuanian ($115,395, a difference of 0.14%), Immigrants from Netherlands ($114,987, a difference of 0.21%), and Immigrants from Europe ($115,523, a difference of 0.25%).
| Demographics | Rating | Rank | Median Family Income |
| Chinese | 99.9 /100 | #49 | Exceptional $116,188 |
| Immigrants | Czechoslovakia | 99.9 /100 | #50 | Exceptional $116,165 |
| Immigrants | Malaysia | 99.9 /100 | #51 | Exceptional $115,880 |
| Maltese | 99.9 /100 | #52 | Exceptional $115,862 |
| Immigrants | Norway | 99.9 /100 | #53 | Exceptional $115,847 |
| Immigrants | Europe | 99.9 /100 | #54 | Exceptional $115,523 |
| Lithuanians | 99.8 /100 | #55 | Exceptional $115,395 |
| New Zealanders | 99.8 /100 | #56 | Exceptional $115,230 |
| Greeks | 99.8 /100 | #57 | Exceptional $115,192 |
| Immigrants | Indonesia | 99.8 /100 | #58 | Exceptional $115,162 |
| Immigrants | Netherlands | 99.8 /100 | #59 | Exceptional $114,987 |
| Immigrants | Latvia | 99.8 /100 | #60 | Exceptional $114,826 |
| Immigrants | Belarus | 99.8 /100 | #61 | Exceptional $114,586 |
| Mongolians | 99.8 /100 | #62 | Exceptional $114,553 |
| Immigrants | Pakistan | 99.8 /100 | #63 | Exceptional $114,406 |
Demographics Similar to Immigrants from South Central Asia by Median Family Income
In terms of median family income, the demographic groups most similar to Immigrants from South Central Asia are Eastern European ($125,546, a difference of 0.33%), Immigrants from China ($125,540, a difference of 0.33%), Indian (Asian) ($125,312, a difference of 0.51%), Immigrants from Australia ($126,620, a difference of 0.53%), and Immigrants from Eastern Asia ($125,150, a difference of 0.64%).
| Demographics | Rating | Rank | Median Family Income |
| Immigrants | Hong Kong | 100.0 /100 | #7 | Exceptional $131,067 |
| Immigrants | Iran | 100.0 /100 | #8 | Exceptional $130,894 |
| Okinawans | 100.0 /100 | #9 | Exceptional $129,979 |
| Immigrants | Ireland | 100.0 /100 | #10 | Exceptional $127,584 |
| Immigrants | Israel | 100.0 /100 | #11 | Exceptional $127,430 |
| Cypriots | 100.0 /100 | #12 | Exceptional $127,064 |
| Immigrants | Australia | 100.0 /100 | #13 | Exceptional $126,620 |
| Immigrants | South Central Asia | 100.0 /100 | #14 | Exceptional $125,956 |
| Eastern Europeans | 100.0 /100 | #15 | Exceptional $125,546 |
| Immigrants | China | 100.0 /100 | #16 | Exceptional $125,540 |
| Indians (Asian) | 100.0 /100 | #17 | Exceptional $125,312 |
| Immigrants | Eastern Asia | 100.0 /100 | #18 | Exceptional $125,150 |
| Immigrants | Belgium | 100.0 /100 | #19 | Exceptional $123,831 |
| Burmese | 100.0 /100 | #20 | Exceptional $123,369 |
| Immigrants | Korea | 100.0 /100 | #21 | Exceptional $122,800 |