Somali vs Immigrants from South Central Asia Median Family Income
COMPARE
Somali
Immigrants from South Central Asia
Median Family Income
Median Family Income Comparison
Somalis
Immigrants from South Central Asia
$94,085
MEDIAN FAMILY INCOME
1.2/ 100
METRIC RATING
240th/ 347
METRIC RANK
$125,956
MEDIAN FAMILY INCOME
100.0/ 100
METRIC RATING
14th/ 347
METRIC RANK
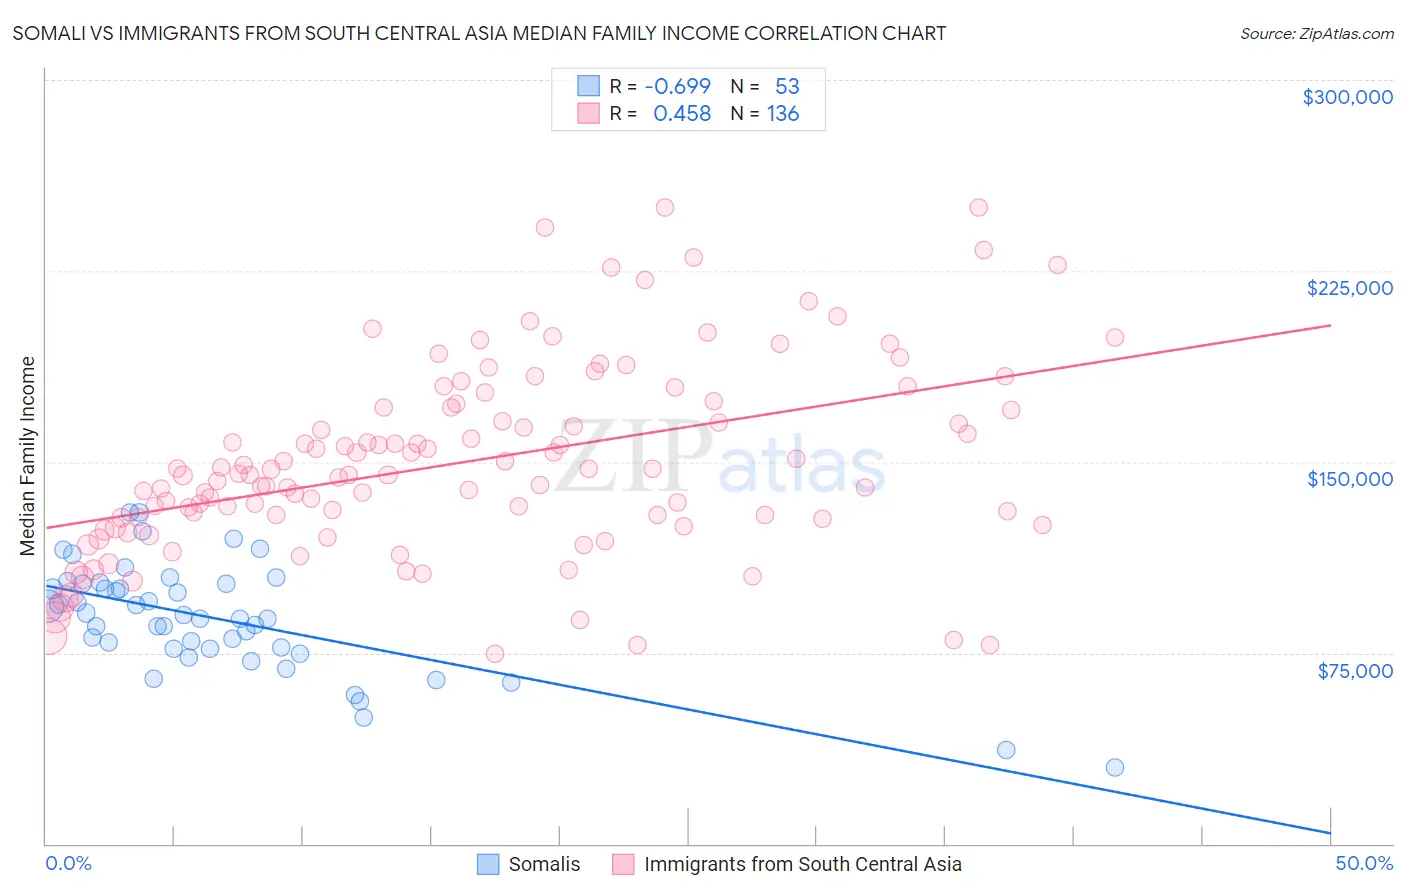
Somali vs Immigrants from South Central Asia Median Family Income Correlation Chart
The statistical analysis conducted on geographies consisting of 99,278,232 people shows a significant negative correlation between the proportion of Somalis and median family income in the United States with a correlation coefficient (R) of -0.699 and weighted average of $94,085. Similarly, the statistical analysis conducted on geographies consisting of 472,438,765 people shows a moderate positive correlation between the proportion of Immigrants from South Central Asia and median family income in the United States with a correlation coefficient (R) of 0.458 and weighted average of $125,956, a difference of 33.9%.
Median Family Income Correlation Summary
| Measurement | Somali | Immigrants from South Central Asia |
| Minimum | $29,978 | $74,415 |
| Maximum | $130,246 | $250,001 |
| Range | $100,268 | $175,586 |
| Mean | $88,236 | $149,714 |
| Median | $88,476 | $145,025 |
| Interquartile 25% (IQ1) | $76,386 | $127,772 |
| Interquartile 75% (IQ3) | $102,172 | $171,402 |
| Interquartile Range (IQR) | $25,786 | $43,630 |
| Standard Deviation (Sample) | $21,250 | $37,158 |
| Standard Deviation (Population) | $21,049 | $37,021 |
Similar Demographics by Median Family Income
Demographics Similar to Somalis by Median Family Income
In terms of median family income, the demographic groups most similar to Somalis are Salvadoran ($94,109, a difference of 0.030%), Nepalese ($94,153, a difference of 0.070%), Immigrants from Trinidad and Tobago ($93,988, a difference of 0.10%), Barbadian ($93,919, a difference of 0.18%), and German Russian ($93,858, a difference of 0.24%).
| Demographics | Rating | Rank | Median Family Income |
| Immigrants | Bangladesh | 1.6 /100 | #233 | Tragic $94,665 |
| Immigrants | Western Africa | 1.6 /100 | #234 | Tragic $94,638 |
| Immigrants | Burma/Myanmar | 1.5 /100 | #235 | Tragic $94,472 |
| Trinidadians and Tobagonians | 1.5 /100 | #236 | Tragic $94,466 |
| Alaskan Athabascans | 1.5 /100 | #237 | Tragic $94,429 |
| Nepalese | 1.3 /100 | #238 | Tragic $94,153 |
| Salvadorans | 1.2 /100 | #239 | Tragic $94,109 |
| Somalis | 1.2 /100 | #240 | Tragic $94,085 |
| Immigrants | Trinidad and Tobago | 1.2 /100 | #241 | Tragic $93,988 |
| Barbadians | 1.1 /100 | #242 | Tragic $93,919 |
| German Russians | 1.1 /100 | #243 | Tragic $93,858 |
| Sub-Saharan Africans | 1.0 /100 | #244 | Tragic $93,748 |
| Immigrants | Middle Africa | 1.0 /100 | #245 | Tragic $93,593 |
| Guyanese | 0.9 /100 | #246 | Tragic $93,373 |
| Immigrants | Senegal | 0.7 /100 | #247 | Tragic $92,912 |
Demographics Similar to Immigrants from South Central Asia by Median Family Income
In terms of median family income, the demographic groups most similar to Immigrants from South Central Asia are Eastern European ($125,546, a difference of 0.33%), Immigrants from China ($125,540, a difference of 0.33%), Indian (Asian) ($125,312, a difference of 0.51%), Immigrants from Australia ($126,620, a difference of 0.53%), and Immigrants from Eastern Asia ($125,150, a difference of 0.64%).
| Demographics | Rating | Rank | Median Family Income |
| Immigrants | Hong Kong | 100.0 /100 | #7 | Exceptional $131,067 |
| Immigrants | Iran | 100.0 /100 | #8 | Exceptional $130,894 |
| Okinawans | 100.0 /100 | #9 | Exceptional $129,979 |
| Immigrants | Ireland | 100.0 /100 | #10 | Exceptional $127,584 |
| Immigrants | Israel | 100.0 /100 | #11 | Exceptional $127,430 |
| Cypriots | 100.0 /100 | #12 | Exceptional $127,064 |
| Immigrants | Australia | 100.0 /100 | #13 | Exceptional $126,620 |
| Immigrants | South Central Asia | 100.0 /100 | #14 | Exceptional $125,956 |
| Eastern Europeans | 100.0 /100 | #15 | Exceptional $125,546 |
| Immigrants | China | 100.0 /100 | #16 | Exceptional $125,540 |
| Indians (Asian) | 100.0 /100 | #17 | Exceptional $125,312 |
| Immigrants | Eastern Asia | 100.0 /100 | #18 | Exceptional $125,150 |
| Immigrants | Belgium | 100.0 /100 | #19 | Exceptional $123,831 |
| Burmese | 100.0 /100 | #20 | Exceptional $123,369 |
| Immigrants | Korea | 100.0 /100 | #21 | Exceptional $122,800 |