New Zealander vs Immigrants from South Central Asia Disability Age Over 75
COMPARE
New Zealander
Immigrants from South Central Asia
Disability Age Over 75
Disability Age Over 75 Comparison
New Zealanders
Immigrants from South Central Asia
46.2%
DISABILITY AGE OVER 75
98.8/ 100
METRIC RATING
81st/ 347
METRIC RANK
46.0%
DISABILITY AGE OVER 75
99.4/ 100
METRIC RATING
68th/ 347
METRIC RANK
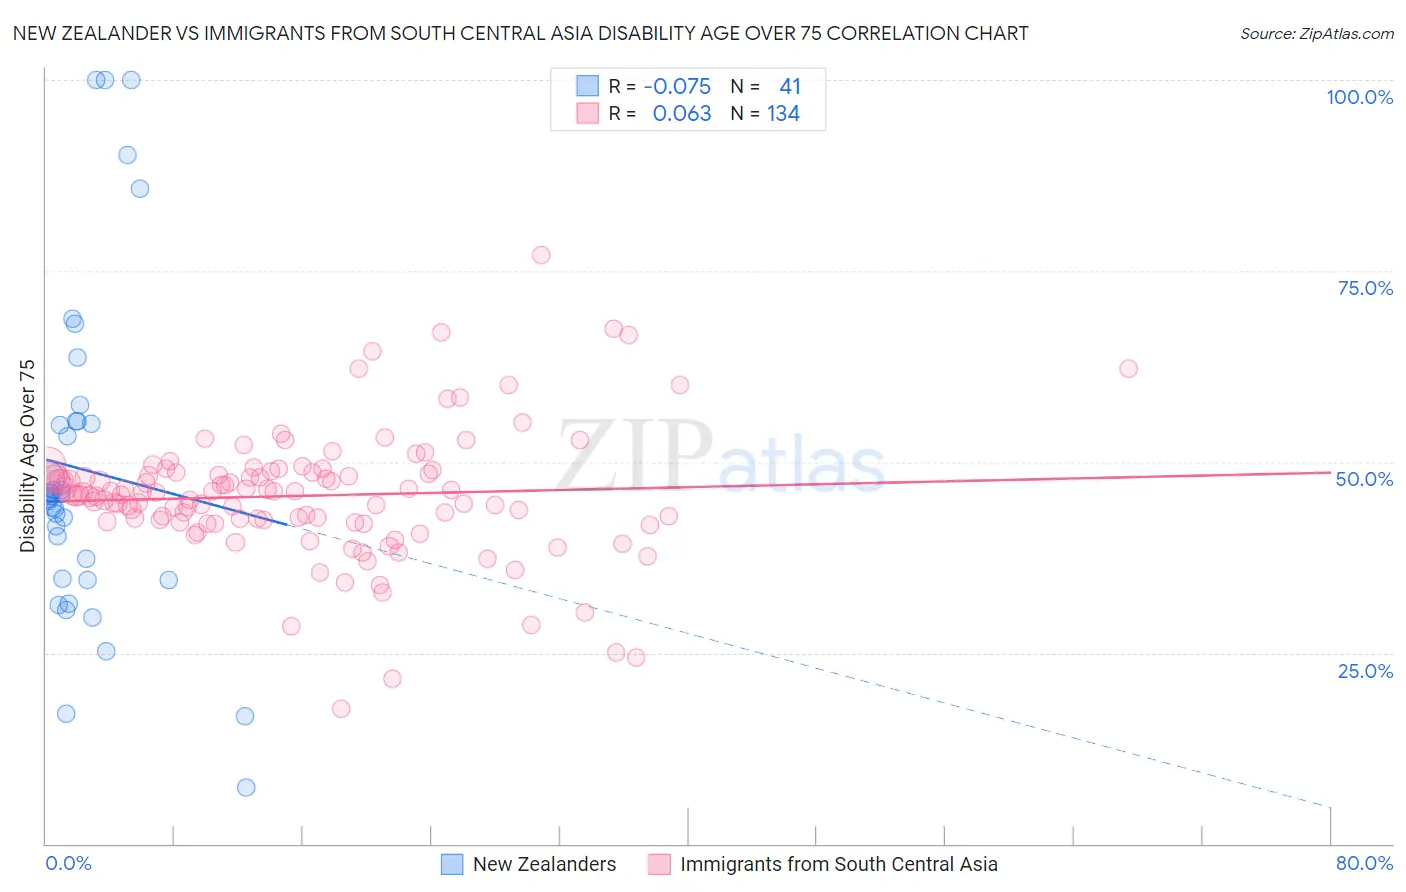
New Zealander vs Immigrants from South Central Asia Disability Age Over 75 Correlation Chart
The statistical analysis conducted on geographies consisting of 106,876,595 people shows a slight negative correlation between the proportion of New Zealanders and percentage of population with a disability over the age of 75 in the United States with a correlation coefficient (R) of -0.075 and weighted average of 46.2%. Similarly, the statistical analysis conducted on geographies consisting of 471,983,818 people shows a slight positive correlation between the proportion of Immigrants from South Central Asia and percentage of population with a disability over the age of 75 in the United States with a correlation coefficient (R) of 0.063 and weighted average of 46.0%, a difference of 0.43%.
Disability Age Over 75 Correlation Summary
| Measurement | New Zealander | Immigrants from South Central Asia |
| Minimum | 7.4% | 17.6% |
| Maximum | 100.0% | 77.1% |
| Range | 92.6% | 59.4% |
| Mean | 49.0% | 45.6% |
| Median | 45.6% | 45.7% |
| Interquartile 25% (IQ1) | 34.6% | 42.2% |
| Interquartile 75% (IQ3) | 55.3% | 48.6% |
| Interquartile Range (IQR) | 20.7% | 6.4% |
| Standard Deviation (Sample) | 21.7% | 8.4% |
| Standard Deviation (Population) | 21.5% | 8.4% |
Demographics Similar to New Zealanders and Immigrants from South Central Asia by Disability Age Over 75
In terms of disability age over 75, the demographic groups most similar to New Zealanders are Soviet Union (46.2%, a difference of 0.0%), Swiss (46.2%, a difference of 0.010%), Immigrants from Latvia (46.2%, a difference of 0.020%), Argentinean (46.2%, a difference of 0.020%), and Immigrants from Jordan (46.2%, a difference of 0.030%). Similarly, the demographic groups most similar to Immigrants from South Central Asia are Immigrants from Spain (46.0%, a difference of 0.040%), Immigrants from Romania (46.0%, a difference of 0.060%), Austrian (46.0%, a difference of 0.070%), Immigrants from England (46.0%, a difference of 0.070%), and Immigrants from North Macedonia (45.9%, a difference of 0.11%).
| Demographics | Rating | Rank | Disability Age Over 75 |
| Immigrants | North Macedonia | 99.5 /100 | #64 | Exceptional 45.9% |
| Austrians | 99.5 /100 | #65 | Exceptional 46.0% |
| Immigrants | England | 99.5 /100 | #66 | Exceptional 46.0% |
| Immigrants | Spain | 99.4 /100 | #67 | Exceptional 46.0% |
| Immigrants | South Central Asia | 99.4 /100 | #68 | Exceptional 46.0% |
| Immigrants | Romania | 99.3 /100 | #69 | Exceptional 46.0% |
| Jordanians | 99.2 /100 | #70 | Exceptional 46.1% |
| Immigrants | Sri Lanka | 99.2 /100 | #71 | Exceptional 46.1% |
| Immigrants | Hungary | 99.1 /100 | #72 | Exceptional 46.1% |
| Cambodians | 99.1 /100 | #73 | Exceptional 46.1% |
| Egyptians | 99.0 /100 | #74 | Exceptional 46.1% |
| Serbians | 99.0 /100 | #75 | Exceptional 46.1% |
| Slavs | 98.9 /100 | #76 | Exceptional 46.1% |
| Immigrants | Eastern Asia | 98.9 /100 | #77 | Exceptional 46.2% |
| Immigrants | Western Europe | 98.8 /100 | #78 | Exceptional 46.2% |
| Swiss | 98.8 /100 | #79 | Exceptional 46.2% |
| Soviet Union | 98.8 /100 | #80 | Exceptional 46.2% |
| New Zealanders | 98.8 /100 | #81 | Exceptional 46.2% |
| Immigrants | Latvia | 98.7 /100 | #82 | Exceptional 46.2% |
| Argentineans | 98.7 /100 | #83 | Exceptional 46.2% |
| Immigrants | Jordan | 98.7 /100 | #84 | Exceptional 46.2% |