Nepalese vs Immigrants from Western Europe Master's Degree
COMPARE
Nepalese
Immigrants from Western Europe
Master's Degree
Master's Degree Comparison
Nepalese
Immigrants from Western Europe
10.5%
MASTER'S DEGREE
0.0/ 100
METRIC RATING
329th/ 347
METRIC RANK
17.8%
MASTER'S DEGREE
99.8/ 100
METRIC RATING
70th/ 347
METRIC RANK
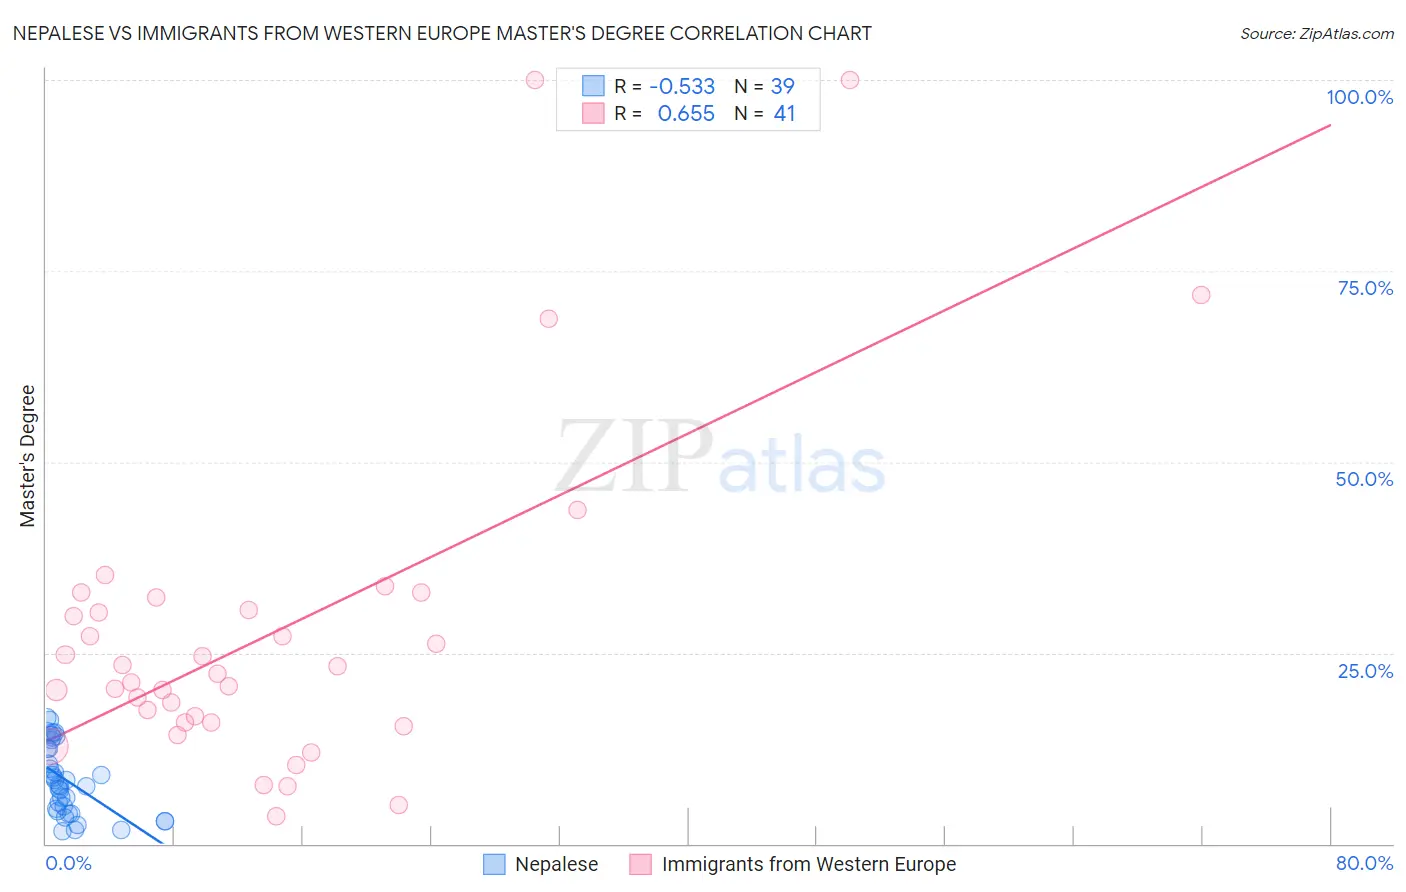
Nepalese vs Immigrants from Western Europe Master's Degree Correlation Chart
The statistical analysis conducted on geographies consisting of 24,519,269 people shows a substantial negative correlation between the proportion of Nepalese and percentage of population with at least master's degree education in the United States with a correlation coefficient (R) of -0.533 and weighted average of 10.5%. Similarly, the statistical analysis conducted on geographies consisting of 493,893,218 people shows a significant positive correlation between the proportion of Immigrants from Western Europe and percentage of population with at least master's degree education in the United States with a correlation coefficient (R) of 0.655 and weighted average of 17.8%, a difference of 70.2%.
Master's Degree Correlation Summary
| Measurement | Nepalese | Immigrants from Western Europe |
| Minimum | 1.7% | 3.7% |
| Maximum | 16.5% | 100.0% |
| Range | 14.8% | 96.3% |
| Mean | 8.3% | 27.7% |
| Median | 7.8% | 22.3% |
| Interquartile 25% (IQ1) | 4.2% | 15.8% |
| Interquartile 75% (IQ3) | 12.5% | 31.4% |
| Interquartile Range (IQR) | 8.3% | 15.5% |
| Standard Deviation (Sample) | 4.5% | 21.5% |
| Standard Deviation (Population) | 4.4% | 21.3% |
Similar Demographics by Master's Degree
Demographics Similar to Nepalese by Master's Degree
In terms of master's degree, the demographic groups most similar to Nepalese are Bangladeshi (10.5%, a difference of 0.080%), Paiute (10.5%, a difference of 0.21%), Inupiat (10.5%, a difference of 0.40%), Creek (10.5%, a difference of 0.40%), and Dutch West Indian (10.6%, a difference of 1.5%).
| Demographics | Rating | Rank | Master's Degree |
| Sioux | 0.0 /100 | #322 | Tragic 10.7% |
| Crow | 0.0 /100 | #323 | Tragic 10.6% |
| Dutch West Indians | 0.0 /100 | #324 | Tragic 10.6% |
| Inupiat | 0.0 /100 | #325 | Tragic 10.5% |
| Creek | 0.0 /100 | #326 | Tragic 10.5% |
| Paiute | 0.0 /100 | #327 | Tragic 10.5% |
| Bangladeshis | 0.0 /100 | #328 | Tragic 10.5% |
| Nepalese | 0.0 /100 | #329 | Tragic 10.5% |
| Fijians | 0.0 /100 | #330 | Tragic 10.3% |
| Pueblo | 0.0 /100 | #331 | Tragic 10.3% |
| Immigrants | Azores | 0.0 /100 | #332 | Tragic 10.2% |
| Menominee | 0.0 /100 | #333 | Tragic 10.2% |
| Arapaho | 0.0 /100 | #334 | Tragic 10.0% |
| Immigrants | Central America | 0.0 /100 | #335 | Tragic 10.0% |
| Natives/Alaskans | 0.0 /100 | #336 | Tragic 9.9% |
Demographics Similar to Immigrants from Western Europe by Master's Degree
In terms of master's degree, the demographic groups most similar to Immigrants from Western Europe are Immigrants from Uzbekistan (17.9%, a difference of 0.22%), Immigrants from Pakistan (17.8%, a difference of 0.28%), Lithuanian (17.7%, a difference of 0.46%), Immigrants from Ethiopia (17.9%, a difference of 0.54%), and Zimbabwean (17.7%, a difference of 0.57%).
| Demographics | Rating | Rank | Master's Degree |
| Immigrants | Netherlands | 99.9 /100 | #63 | Exceptional 18.1% |
| South Africans | 99.9 /100 | #64 | Exceptional 18.1% |
| Immigrants | Kazakhstan | 99.8 /100 | #65 | Exceptional 18.0% |
| Ethiopians | 99.8 /100 | #66 | Exceptional 18.0% |
| Immigrants | Argentina | 99.8 /100 | #67 | Exceptional 18.0% |
| Immigrants | Ethiopia | 99.8 /100 | #68 | Exceptional 17.9% |
| Immigrants | Uzbekistan | 99.8 /100 | #69 | Exceptional 17.9% |
| Immigrants | Western Europe | 99.8 /100 | #70 | Exceptional 17.8% |
| Immigrants | Pakistan | 99.7 /100 | #71 | Exceptional 17.8% |
| Lithuanians | 99.7 /100 | #72 | Exceptional 17.7% |
| Zimbabweans | 99.7 /100 | #73 | Exceptional 17.7% |
| Immigrants | Romania | 99.7 /100 | #74 | Exceptional 17.7% |
| Egyptians | 99.6 /100 | #75 | Exceptional 17.6% |
| Immigrants | Indonesia | 99.6 /100 | #76 | Exceptional 17.6% |
| Immigrants | Eastern Europe | 99.6 /100 | #77 | Exceptional 17.6% |