Nepalese vs Dutch Per Capita Income
COMPARE
Nepalese
Dutch
Per Capita Income
Per Capita Income Comparison
Nepalese
Dutch
$38,442
PER CAPITA INCOME
0.3/ 100
METRIC RATING
273rd/ 347
METRIC RANK
$42,605
PER CAPITA INCOME
23.4/ 100
METRIC RATING
196th/ 347
METRIC RANK
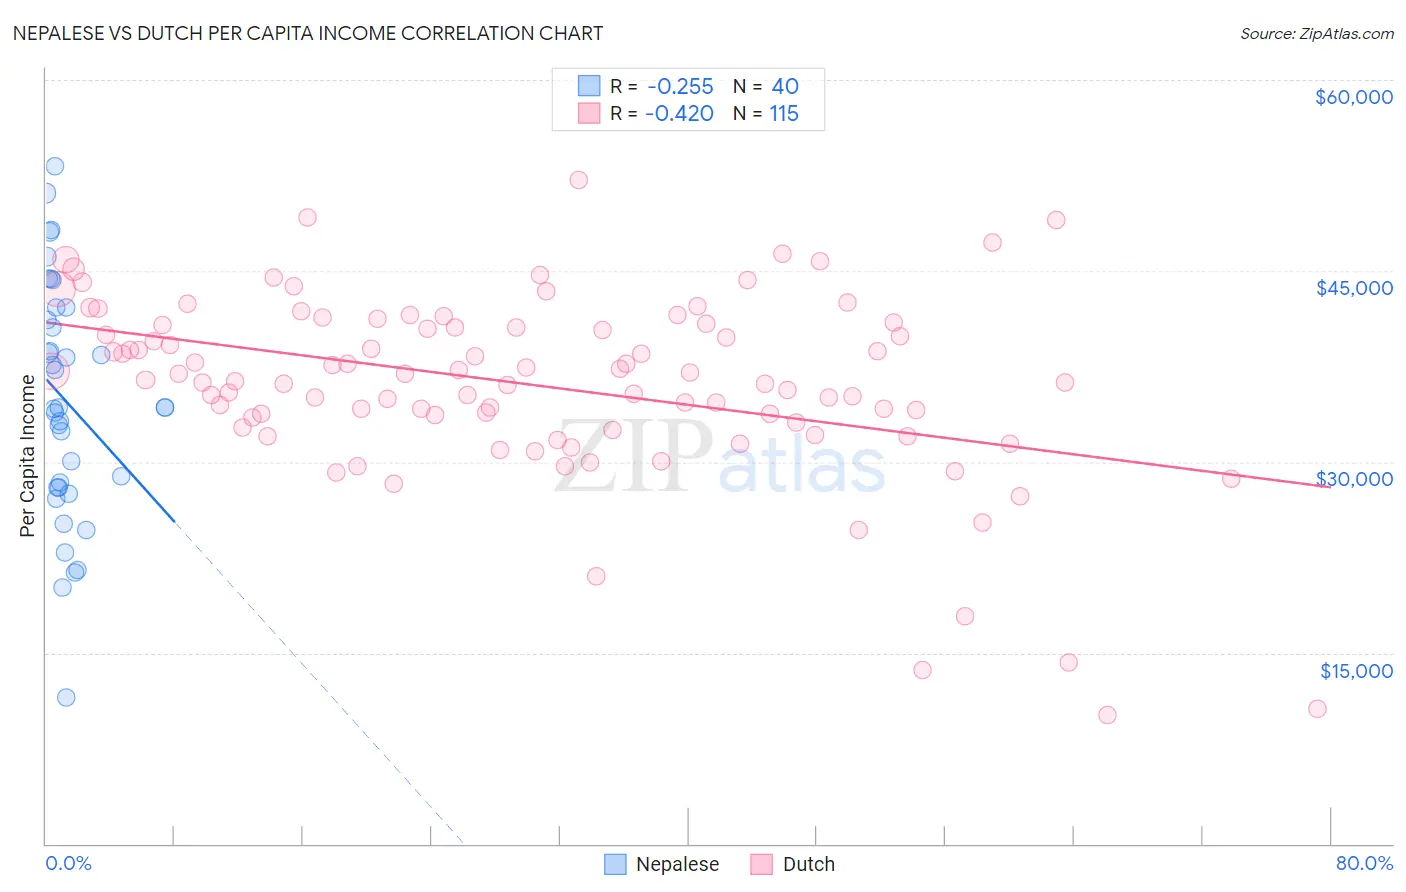
Nepalese vs Dutch Per Capita Income Correlation Chart
The statistical analysis conducted on geographies consisting of 24,521,755 people shows a weak negative correlation between the proportion of Nepalese and per capita income in the United States with a correlation coefficient (R) of -0.255 and weighted average of $38,442. Similarly, the statistical analysis conducted on geographies consisting of 554,404,949 people shows a moderate negative correlation between the proportion of Dutch and per capita income in the United States with a correlation coefficient (R) of -0.420 and weighted average of $42,605, a difference of 10.8%.
Per Capita Income Correlation Summary
| Measurement | Nepalese | Dutch |
| Minimum | $11,464 | $10,108 |
| Maximum | $53,263 | $52,150 |
| Range | $41,799 | $42,042 |
| Mean | $34,718 | $36,061 |
| Median | $34,262 | $36,441 |
| Interquartile 25% (IQ1) | $28,014 | $33,045 |
| Interquartile 75% (IQ3) | $41,612 | $40,758 |
| Interquartile Range (IQR) | $13,598 | $7,713 |
| Standard Deviation (Sample) | $9,316 | $7,274 |
| Standard Deviation (Population) | $9,199 | $7,242 |
Similar Demographics by Per Capita Income
Demographics Similar to Nepalese by Per Capita Income
In terms of per capita income, the demographic groups most similar to Nepalese are Immigrants from El Salvador ($38,394, a difference of 0.13%), Immigrants from Cabo Verde ($38,540, a difference of 0.25%), Central American ($38,560, a difference of 0.31%), Immigrants from Belize ($38,614, a difference of 0.45%), and Immigrants from Liberia ($38,165, a difference of 0.73%).
| Demographics | Rating | Rank | Per Capita Income |
| Salvadorans | 0.5 /100 | #266 | Tragic $38,858 |
| Immigrants | Zaire | 0.4 /100 | #267 | Tragic $38,848 |
| Liberians | 0.4 /100 | #268 | Tragic $38,780 |
| Immigrants | Jamaica | 0.4 /100 | #269 | Tragic $38,766 |
| Immigrants | Belize | 0.3 /100 | #270 | Tragic $38,614 |
| Central Americans | 0.3 /100 | #271 | Tragic $38,560 |
| Immigrants | Cabo Verde | 0.3 /100 | #272 | Tragic $38,540 |
| Nepalese | 0.3 /100 | #273 | Tragic $38,442 |
| Immigrants | El Salvador | 0.3 /100 | #274 | Tragic $38,394 |
| Immigrants | Liberia | 0.2 /100 | #275 | Tragic $38,165 |
| Hmong | 0.2 /100 | #276 | Tragic $38,120 |
| Comanche | 0.2 /100 | #277 | Tragic $38,088 |
| Immigrants | Nicaragua | 0.2 /100 | #278 | Tragic $38,065 |
| Colville | 0.2 /100 | #279 | Tragic $38,047 |
| Potawatomi | 0.2 /100 | #280 | Tragic $38,046 |
Demographics Similar to Dutch by Per Capita Income
In terms of per capita income, the demographic groups most similar to Dutch are Scotch-Irish ($42,563, a difference of 0.10%), Immigrants from Kenya ($42,661, a difference of 0.13%), Immigrants from Fiji ($42,694, a difference of 0.21%), Immigrants from Sierra Leone ($42,752, a difference of 0.34%), and Iraqi ($42,760, a difference of 0.36%).
| Demographics | Rating | Rank | Per Capita Income |
| Bermudans | 30.1 /100 | #189 | Fair $42,911 |
| Kenyans | 27.7 /100 | #190 | Fair $42,808 |
| Yugoslavians | 27.4 /100 | #191 | Fair $42,792 |
| Iraqis | 26.7 /100 | #192 | Fair $42,760 |
| Immigrants | Sierra Leone | 26.5 /100 | #193 | Fair $42,752 |
| Immigrants | Fiji | 25.2 /100 | #194 | Fair $42,694 |
| Immigrants | Kenya | 24.5 /100 | #195 | Fair $42,661 |
| Dutch | 23.4 /100 | #196 | Fair $42,605 |
| Scotch-Irish | 22.6 /100 | #197 | Fair $42,563 |
| Immigrants | Portugal | 19.7 /100 | #198 | Poor $42,412 |
| Barbadians | 19.6 /100 | #199 | Poor $42,406 |
| Vietnamese | 19.0 /100 | #200 | Poor $42,368 |
| Immigrants | Thailand | 17.6 /100 | #201 | Poor $42,289 |
| Immigrants | Bosnia and Herzegovina | 17.5 /100 | #202 | Poor $42,278 |
| Spanish | 17.0 /100 | #203 | Poor $42,249 |