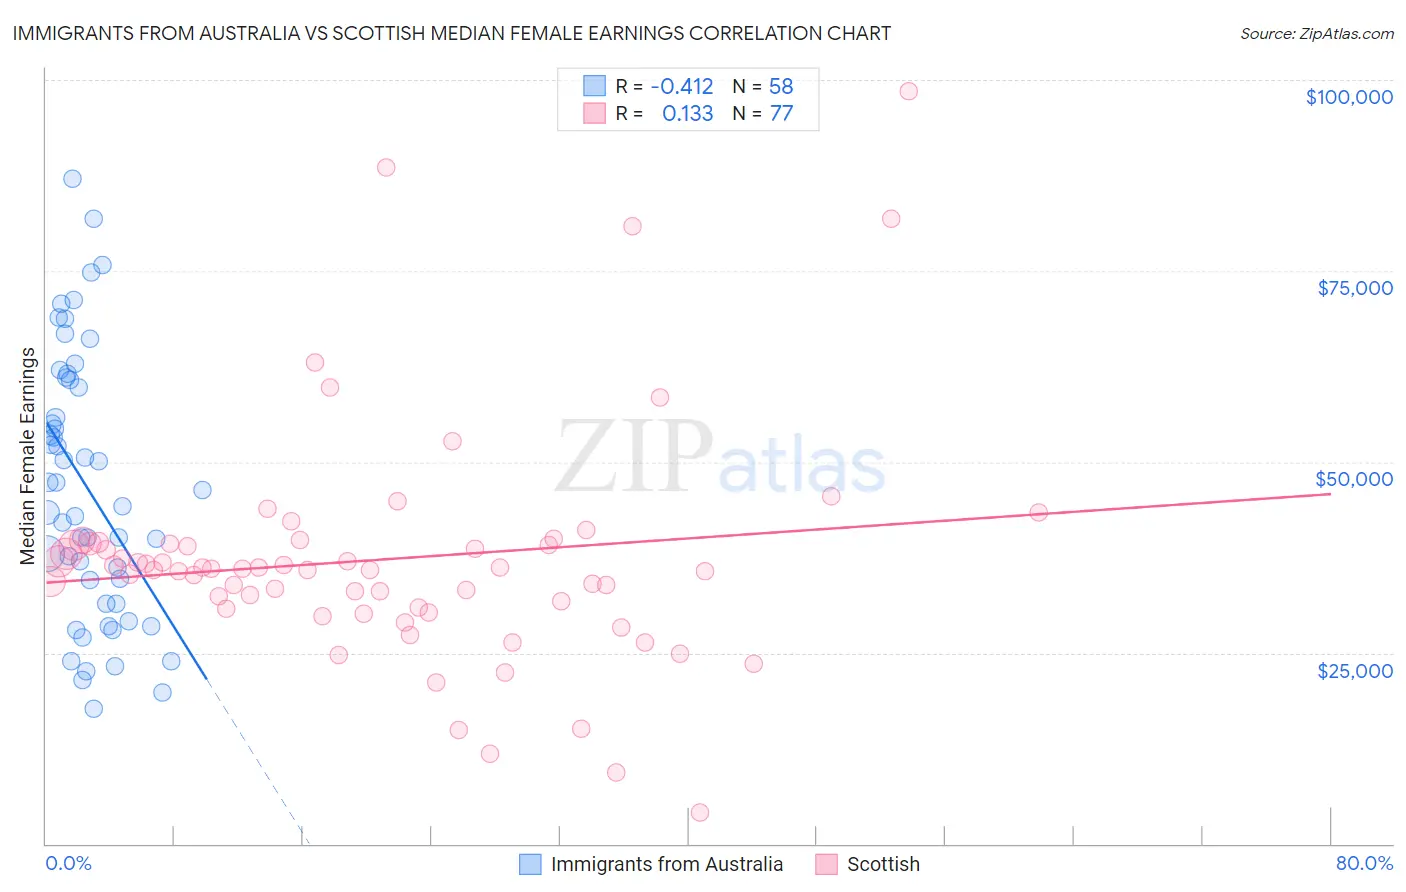
Immigrants from Australia vs Scottish Median Female Earnings
COMPARE
Immigrants from Australia
Scottish
Median Female Earnings
Median Female Earnings Comparison
Immigrants from Australia
Scottish
$46,573
MEDIAN FEMALE EARNINGS
100.0/ 100
METRIC RATING
13th/ 347
METRIC RANK
$38,397
MEDIAN FEMALE EARNINGS
6.3/ 100
METRIC RATING
227th/ 347
METRIC RANK
Immigrants from Australia vs Scottish Median Female Earnings Correlation Chart
The statistical analysis conducted on geographies consisting of 227,158,397 people shows a moderate negative correlation between the proportion of Immigrants from Australia and median female earnings in the United States with a correlation coefficient (R) of -0.412 and weighted average of $46,573. Similarly, the statistical analysis conducted on geographies consisting of 565,316,168 people shows a poor positive correlation between the proportion of Scottish and median female earnings in the United States with a correlation coefficient (R) of 0.133 and weighted average of $38,397, a difference of 21.3%.
Median Female Earnings Correlation Summary
| Measurement | Immigrants from Australia | Scottish |
| Minimum | $17,627 | $4,115 |
| Maximum | $87,039 | $98,472 |
| Range | $69,412 | $94,357 |
| Mean | $46,604 | $37,218 |
| Median | $45,208 | $35,990 |
| Interquartile 25% (IQ1) | $31,477 | $30,914 |
| Interquartile 75% (IQ3) | $60,732 | $39,333 |
| Interquartile Range (IQR) | $29,255 | $8,419 |
| Standard Deviation (Sample) | $17,219 | $15,319 |
| Standard Deviation (Population) | $17,070 | $15,219 |
Similar Demographics by Median Female Earnings
Demographics Similar to Immigrants from Australia by Median Female Earnings
In terms of median female earnings, the demographic groups most similar to Immigrants from Australia are Soviet Union ($46,556, a difference of 0.040%), Immigrants from Eastern Asia ($46,502, a difference of 0.15%), Indian (Asian) ($46,481, a difference of 0.20%), Immigrants from South Central Asia ($46,324, a difference of 0.54%), and Okinawan ($46,905, a difference of 0.71%).
| Demographics | Rating | Rank | Median Female Earnings |
| Immigrants | Ireland | 100.0 /100 | #6 | Exceptional $47,598 |
| Thais | 100.0 /100 | #7 | Exceptional $47,577 |
| Iranians | 100.0 /100 | #8 | Exceptional $47,421 |
| Immigrants | Iran | 100.0 /100 | #9 | Exceptional $47,154 |
| Immigrants | China | 100.0 /100 | #10 | Exceptional $46,972 |
| Okinawans | 100.0 /100 | #11 | Exceptional $46,905 |
| Immigrants | Israel | 100.0 /100 | #12 | Exceptional $46,902 |
| Immigrants | Australia | 100.0 /100 | #13 | Exceptional $46,573 |
| Soviet Union | 100.0 /100 | #14 | Exceptional $46,556 |
| Immigrants | Eastern Asia | 100.0 /100 | #15 | Exceptional $46,502 |
| Indians (Asian) | 100.0 /100 | #16 | Exceptional $46,481 |
| Immigrants | South Central Asia | 100.0 /100 | #17 | Exceptional $46,324 |
| Cypriots | 100.0 /100 | #18 | Exceptional $45,570 |
| Eastern Europeans | 100.0 /100 | #19 | Exceptional $45,385 |
| Immigrants | Japan | 100.0 /100 | #20 | Exceptional $45,323 |
Demographics Similar to Scottish by Median Female Earnings
In terms of median female earnings, the demographic groups most similar to Scottish are Subsaharan African ($38,391, a difference of 0.020%), Belgian ($38,382, a difference of 0.040%), French Canadian ($38,436, a difference of 0.10%), Basque ($38,352, a difference of 0.12%), and French ($38,457, a difference of 0.15%).
| Demographics | Rating | Rank | Median Female Earnings |
| Yugoslavians | 8.8 /100 | #220 | Tragic $38,573 |
| Immigrants | Azores | 8.8 /100 | #221 | Tragic $38,573 |
| Japanese | 8.1 /100 | #222 | Tragic $38,528 |
| Immigrants | Sudan | 7.8 /100 | #223 | Tragic $38,511 |
| Native Hawaiians | 7.1 /100 | #224 | Tragic $38,461 |
| French | 7.0 /100 | #225 | Tragic $38,457 |
| French Canadians | 6.8 /100 | #226 | Tragic $38,436 |
| Scottish | 6.3 /100 | #227 | Tragic $38,397 |
| Sub-Saharan Africans | 6.2 /100 | #228 | Tragic $38,391 |
| Belgians | 6.1 /100 | #229 | Tragic $38,382 |
| Basques | 5.7 /100 | #230 | Tragic $38,352 |
| Somalis | 5.5 /100 | #231 | Tragic $38,333 |
| Scandinavians | 5.2 /100 | #232 | Tragic $38,306 |
| Tongans | 5.1 /100 | #233 | Tragic $38,288 |
| Celtics | 5.0 /100 | #234 | Tragic $38,283 |