Mexican American Indian vs Scottish Median Female Earnings
COMPARE
Mexican American Indian
Scottish
Median Female Earnings
Median Female Earnings Comparison
Mexican American Indians
Scottish
$35,629
MEDIAN FEMALE EARNINGS
0.0/ 100
METRIC RATING
296th/ 347
METRIC RANK
$38,397
MEDIAN FEMALE EARNINGS
6.3/ 100
METRIC RATING
227th/ 347
METRIC RANK
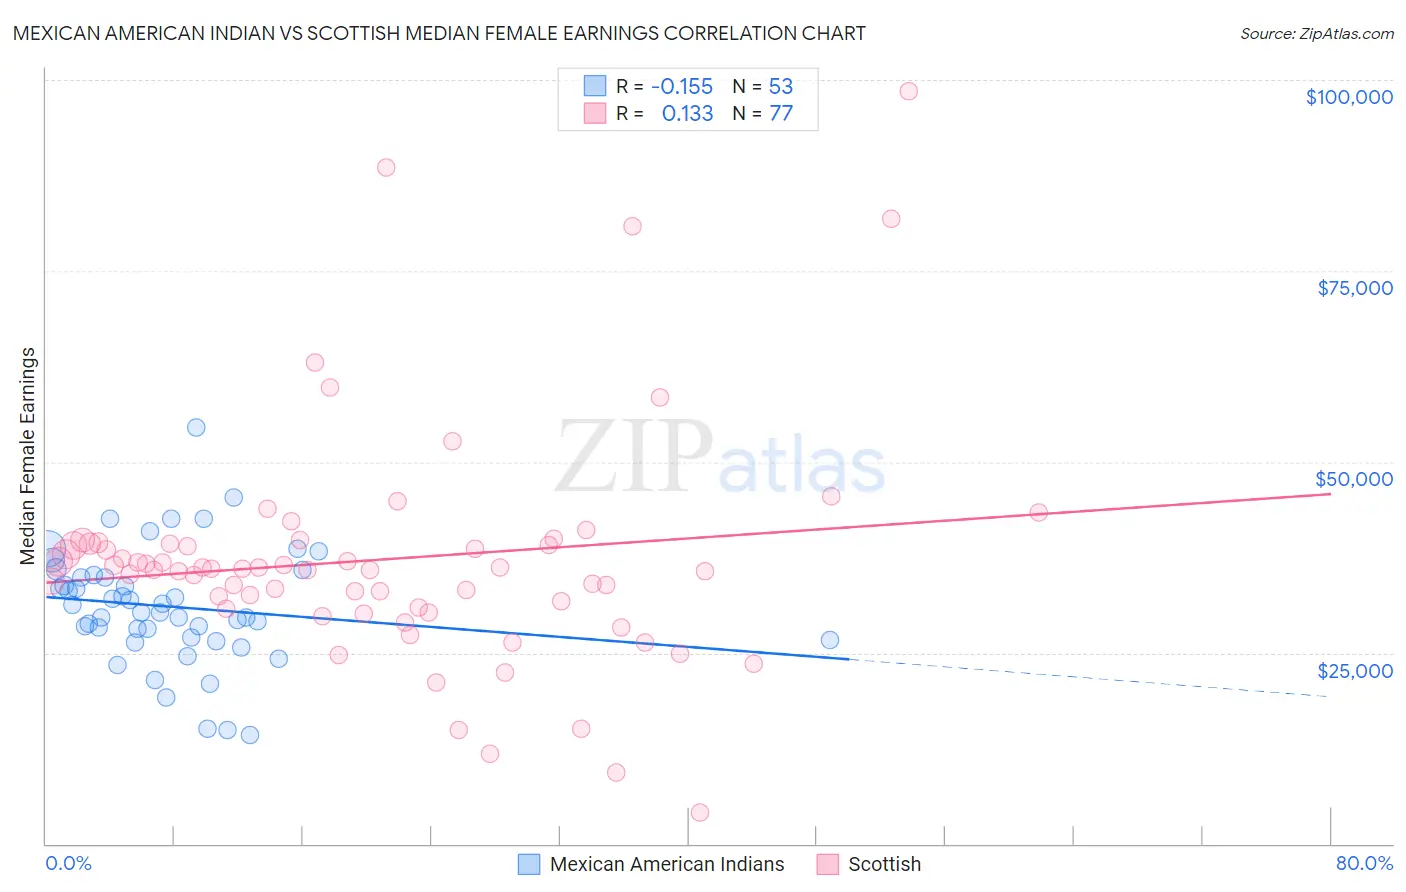
Mexican American Indian vs Scottish Median Female Earnings Correlation Chart
The statistical analysis conducted on geographies consisting of 317,476,651 people shows a poor negative correlation between the proportion of Mexican American Indians and median female earnings in the United States with a correlation coefficient (R) of -0.155 and weighted average of $35,629. Similarly, the statistical analysis conducted on geographies consisting of 565,316,168 people shows a poor positive correlation between the proportion of Scottish and median female earnings in the United States with a correlation coefficient (R) of 0.133 and weighted average of $38,397, a difference of 7.8%.
Median Female Earnings Correlation Summary
| Measurement | Mexican American Indian | Scottish |
| Minimum | $14,250 | $4,115 |
| Maximum | $54,477 | $98,472 |
| Range | $40,227 | $94,357 |
| Mean | $31,030 | $37,218 |
| Median | $30,267 | $35,990 |
| Interquartile 25% (IQ1) | $26,842 | $30,914 |
| Interquartile 75% (IQ3) | $35,013 | $39,333 |
| Interquartile Range (IQR) | $8,171 | $8,419 |
| Standard Deviation (Sample) | $7,625 | $15,319 |
| Standard Deviation (Population) | $7,553 | $15,219 |
Similar Demographics by Median Female Earnings
Demographics Similar to Mexican American Indians by Median Female Earnings
In terms of median female earnings, the demographic groups most similar to Mexican American Indians are Comanche ($35,661, a difference of 0.090%), Cheyenne ($35,673, a difference of 0.12%), Guatemalan ($35,695, a difference of 0.19%), Hmong ($35,498, a difference of 0.37%), and American ($35,777, a difference of 0.42%).
| Demographics | Rating | Rank | Median Female Earnings |
| Bangladeshis | 0.0 /100 | #289 | Tragic $35,960 |
| Central American Indians | 0.0 /100 | #290 | Tragic $35,930 |
| Blackfeet | 0.0 /100 | #291 | Tragic $35,864 |
| Americans | 0.0 /100 | #292 | Tragic $35,777 |
| Guatemalans | 0.0 /100 | #293 | Tragic $35,695 |
| Cheyenne | 0.0 /100 | #294 | Tragic $35,673 |
| Comanche | 0.0 /100 | #295 | Tragic $35,661 |
| Mexican American Indians | 0.0 /100 | #296 | Tragic $35,629 |
| Hmong | 0.0 /100 | #297 | Tragic $35,498 |
| Immigrants | Micronesia | 0.0 /100 | #298 | Tragic $35,477 |
| Immigrants | Guatemala | 0.0 /100 | #299 | Tragic $35,444 |
| Yuman | 0.0 /100 | #300 | Tragic $35,377 |
| Pima | 0.0 /100 | #301 | Tragic $35,326 |
| Blacks/African Americans | 0.0 /100 | #302 | Tragic $35,315 |
| Immigrants | Latin America | 0.0 /100 | #303 | Tragic $35,307 |
Demographics Similar to Scottish by Median Female Earnings
In terms of median female earnings, the demographic groups most similar to Scottish are Subsaharan African ($38,391, a difference of 0.020%), Belgian ($38,382, a difference of 0.040%), French Canadian ($38,436, a difference of 0.10%), Basque ($38,352, a difference of 0.12%), and French ($38,457, a difference of 0.15%).
| Demographics | Rating | Rank | Median Female Earnings |
| Yugoslavians | 8.8 /100 | #220 | Tragic $38,573 |
| Immigrants | Azores | 8.8 /100 | #221 | Tragic $38,573 |
| Japanese | 8.1 /100 | #222 | Tragic $38,528 |
| Immigrants | Sudan | 7.8 /100 | #223 | Tragic $38,511 |
| Native Hawaiians | 7.1 /100 | #224 | Tragic $38,461 |
| French | 7.0 /100 | #225 | Tragic $38,457 |
| French Canadians | 6.8 /100 | #226 | Tragic $38,436 |
| Scottish | 6.3 /100 | #227 | Tragic $38,397 |
| Sub-Saharan Africans | 6.2 /100 | #228 | Tragic $38,391 |
| Belgians | 6.1 /100 | #229 | Tragic $38,382 |
| Basques | 5.7 /100 | #230 | Tragic $38,352 |
| Somalis | 5.5 /100 | #231 | Tragic $38,333 |
| Scandinavians | 5.2 /100 | #232 | Tragic $38,306 |
| Tongans | 5.1 /100 | #233 | Tragic $38,288 |
| Celtics | 5.0 /100 | #234 | Tragic $38,283 |