Navajo vs Immigrants from Uganda Householder Income Ages 45 - 64 years
COMPARE
Navajo
Immigrants from Uganda
Householder Income Ages 45 - 64 years
Householder Income Ages 45 - 64 years Comparison
Navajo
Immigrants from Uganda
$69,759
HOUSEHOLDER INCOME AGES 45 - 64 YEARS
0.0/ 100
METRIC RATING
345th/ 347
METRIC RANK
$103,584
HOUSEHOLDER INCOME AGES 45 - 64 YEARS
83.7/ 100
METRIC RATING
141st/ 347
METRIC RANK
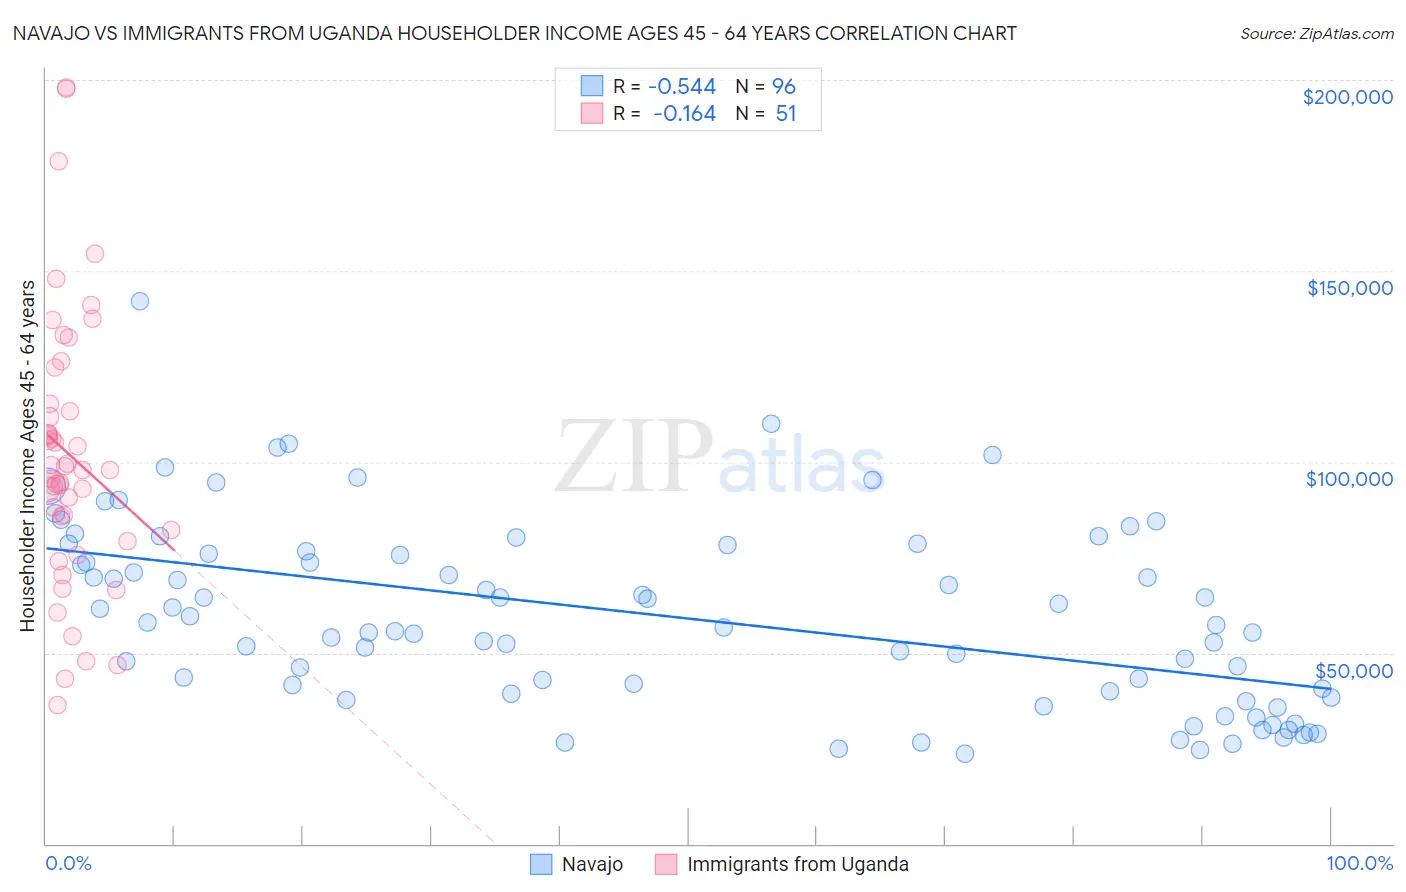
Navajo vs Immigrants from Uganda Householder Income Ages 45 - 64 years Correlation Chart
The statistical analysis conducted on geographies consisting of 224,499,663 people shows a substantial negative correlation between the proportion of Navajo and household income with householder between the ages 45 and 64 in the United States with a correlation coefficient (R) of -0.544 and weighted average of $69,759. Similarly, the statistical analysis conducted on geographies consisting of 125,945,072 people shows a poor negative correlation between the proportion of Immigrants from Uganda and household income with householder between the ages 45 and 64 in the United States with a correlation coefficient (R) of -0.164 and weighted average of $103,584, a difference of 48.5%.
Householder Income Ages 45 - 64 years Correlation Summary
| Measurement | Navajo | Immigrants from Uganda |
| Minimum | $23,688 | $36,234 |
| Maximum | $142,006 | $198,089 |
| Range | $118,318 | $161,856 |
| Mean | $59,518 | $101,898 |
| Median | $57,088 | $97,891 |
| Interquartile 25% (IQ1) | $39,664 | $82,188 |
| Interquartile 75% (IQ3) | $76,283 | $115,253 |
| Interquartile Range (IQR) | $36,618 | $33,065 |
| Standard Deviation (Sample) | $24,055 | $35,142 |
| Standard Deviation (Population) | $23,929 | $34,796 |
Similar Demographics by Householder Income Ages 45 - 64 years
Demographics Similar to Navajo by Householder Income Ages 45 - 64 years
In terms of householder income ages 45 - 64 years, the demographic groups most similar to Navajo are Puerto Rican ($69,234, a difference of 0.76%), Houma ($72,093, a difference of 3.4%), Pima ($73,365, a difference of 5.2%), Tohono O'odham ($73,774, a difference of 5.8%), and Crow ($74,257, a difference of 6.5%).
| Demographics | Rating | Rank | Householder Income Ages 45 - 64 years |
| Immigrants | Congo | 0.0 /100 | #333 | Tragic $77,850 |
| Menominee | 0.0 /100 | #334 | Tragic $76,903 |
| Cheyenne | 0.0 /100 | #335 | Tragic $76,362 |
| Arapaho | 0.0 /100 | #336 | Tragic $75,945 |
| Pueblo | 0.0 /100 | #337 | Tragic $75,601 |
| Hopi | 0.0 /100 | #338 | Tragic $75,562 |
| Kiowa | 0.0 /100 | #339 | Tragic $74,815 |
| Immigrants | Yemen | 0.0 /100 | #340 | Tragic $74,575 |
| Crow | 0.0 /100 | #341 | Tragic $74,257 |
| Tohono O'odham | 0.0 /100 | #342 | Tragic $73,774 |
| Pima | 0.0 /100 | #343 | Tragic $73,365 |
| Houma | 0.0 /100 | #344 | Tragic $72,093 |
| Navajo | 0.0 /100 | #345 | Tragic $69,759 |
| Puerto Ricans | 0.0 /100 | #346 | Tragic $69,234 |
| Lumbee | 0.0 /100 | #347 | Tragic $65,113 |
Demographics Similar to Immigrants from Uganda by Householder Income Ages 45 - 64 years
In terms of householder income ages 45 - 64 years, the demographic groups most similar to Immigrants from Uganda are Luxembourger ($103,536, a difference of 0.050%), Serbian ($103,522, a difference of 0.060%), Czech ($103,507, a difference of 0.070%), Norwegian ($103,682, a difference of 0.090%), and Ugandan ($103,472, a difference of 0.11%).
| Demographics | Rating | Rank | Householder Income Ages 45 - 64 years |
| Canadians | 89.3 /100 | #134 | Excellent $104,560 |
| Brazilians | 88.6 /100 | #135 | Excellent $104,408 |
| Taiwanese | 87.4 /100 | #136 | Excellent $104,180 |
| Hungarians | 85.8 /100 | #137 | Excellent $103,913 |
| Ethiopians | 84.7 /100 | #138 | Excellent $103,736 |
| Immigrants | Oceania | 84.5 /100 | #139 | Excellent $103,705 |
| Norwegians | 84.3 /100 | #140 | Excellent $103,682 |
| Immigrants | Uganda | 83.7 /100 | #141 | Excellent $103,584 |
| Luxembourgers | 83.3 /100 | #142 | Excellent $103,536 |
| Serbians | 83.2 /100 | #143 | Excellent $103,522 |
| Czechs | 83.1 /100 | #144 | Excellent $103,507 |
| Ugandans | 82.9 /100 | #145 | Excellent $103,472 |
| Immigrants | Chile | 82.5 /100 | #146 | Excellent $103,412 |
| Basques | 82.3 /100 | #147 | Excellent $103,387 |
| Immigrants | Germany | 81.5 /100 | #148 | Excellent $103,282 |