Native/Alaskan vs Immigrants from Belize Median Family Income
COMPARE
Native/Alaskan
Immigrants from Belize
Median Family Income
Median Family Income Comparison
Natives/Alaskans
Immigrants from Belize
$80,908
MEDIAN FAMILY INCOME
0.0/ 100
METRIC RATING
332nd/ 347
METRIC RANK
$89,197
MEDIAN FAMILY INCOME
0.1/ 100
METRIC RATING
279th/ 347
METRIC RANK
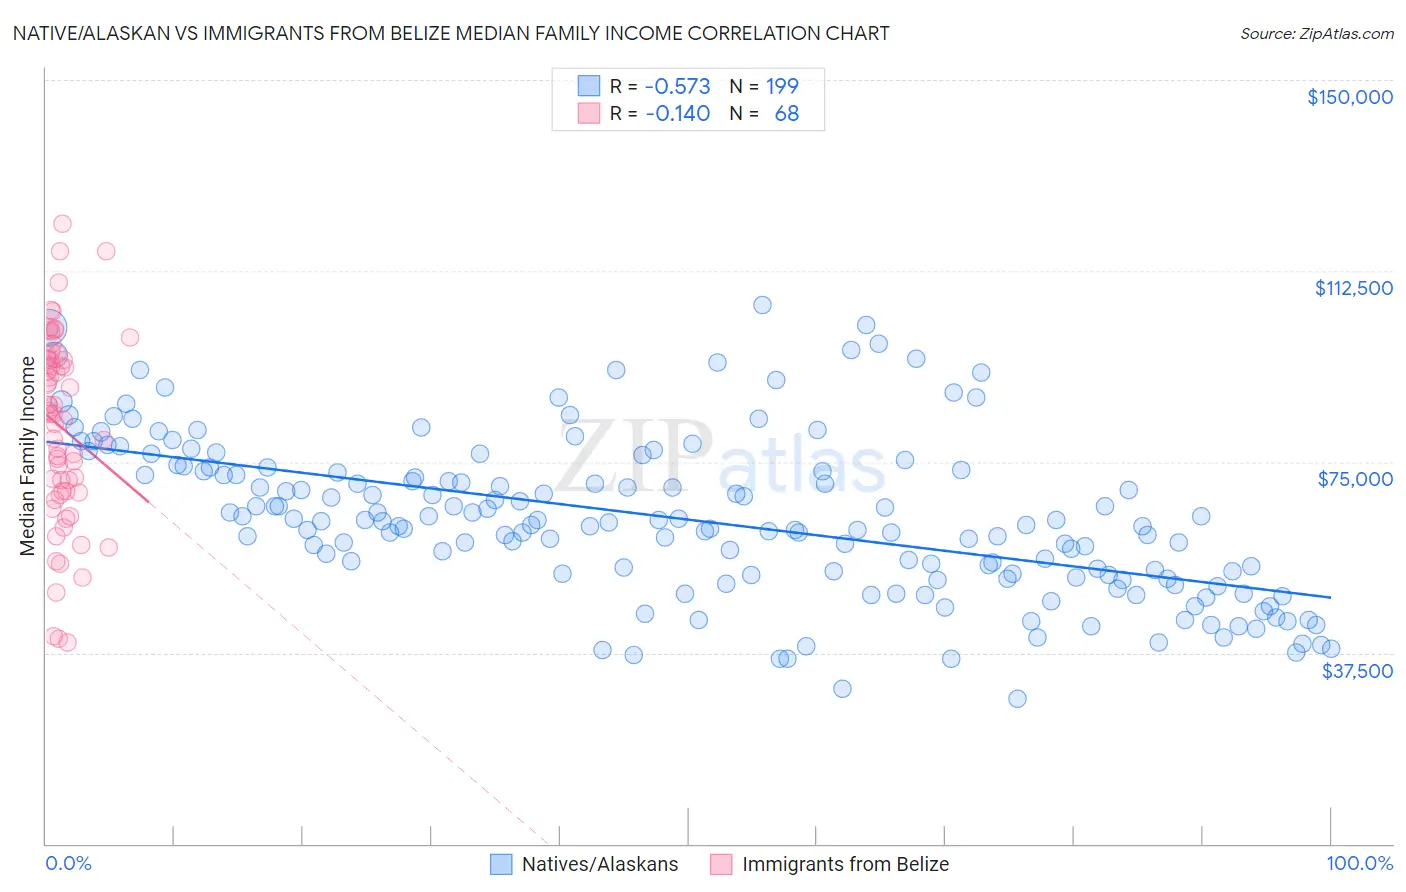
Native/Alaskan vs Immigrants from Belize Median Family Income Correlation Chart
The statistical analysis conducted on geographies consisting of 512,223,526 people shows a substantial negative correlation between the proportion of Natives/Alaskans and median family income in the United States with a correlation coefficient (R) of -0.573 and weighted average of $80,908. Similarly, the statistical analysis conducted on geographies consisting of 130,266,359 people shows a poor negative correlation between the proportion of Immigrants from Belize and median family income in the United States with a correlation coefficient (R) of -0.140 and weighted average of $89,197, a difference of 10.2%.
Median Family Income Correlation Summary
| Measurement | Native/Alaskan | Immigrants from Belize |
| Minimum | $28,542 | $39,621 |
| Maximum | $105,692 | $121,707 |
| Range | $77,150 | $82,086 |
| Mean | $63,631 | $81,787 |
| Median | $62,694 | $84,449 |
| Interquartile 25% (IQ1) | $52,723 | $69,088 |
| Interquartile 75% (IQ3) | $73,193 | $95,112 |
| Interquartile Range (IQR) | $20,470 | $26,023 |
| Standard Deviation (Sample) | $15,516 | $18,723 |
| Standard Deviation (Population) | $15,477 | $18,585 |
Similar Demographics by Median Family Income
Demographics Similar to Natives/Alaskans by Median Family Income
In terms of median family income, the demographic groups most similar to Natives/Alaskans are Kiowa ($80,885, a difference of 0.030%), Immigrants from Dominican Republic ($81,233, a difference of 0.40%), Cheyenne ($81,385, a difference of 0.59%), Dutch West Indian ($81,852, a difference of 1.2%), and Black/African American ($81,912, a difference of 1.2%).
| Demographics | Rating | Rank | Median Family Income |
| Sioux | 0.0 /100 | #325 | Tragic $82,386 |
| Immigrants | Congo | 0.0 /100 | #326 | Tragic $82,216 |
| Arapaho | 0.0 /100 | #327 | Tragic $82,064 |
| Blacks/African Americans | 0.0 /100 | #328 | Tragic $81,912 |
| Dutch West Indians | 0.0 /100 | #329 | Tragic $81,852 |
| Cheyenne | 0.0 /100 | #330 | Tragic $81,385 |
| Immigrants | Dominican Republic | 0.0 /100 | #331 | Tragic $81,233 |
| Natives/Alaskans | 0.0 /100 | #332 | Tragic $80,908 |
| Kiowa | 0.0 /100 | #333 | Tragic $80,885 |
| Menominee | 0.0 /100 | #334 | Tragic $79,563 |
| Yup'ik | 0.0 /100 | #335 | Tragic $79,290 |
| Immigrants | Cuba | 0.0 /100 | #336 | Tragic $78,249 |
| Yuman | 0.0 /100 | #337 | Tragic $78,055 |
| Immigrants | Yemen | 0.0 /100 | #338 | Tragic $77,457 |
| Pima | 0.0 /100 | #339 | Tragic $77,431 |
Demographics Similar to Immigrants from Belize by Median Family Income
In terms of median family income, the demographic groups most similar to Immigrants from Belize are Immigrants from Grenada ($89,249, a difference of 0.060%), Immigrants from Jamaica ($89,268, a difference of 0.080%), Immigrants from Zaire ($89,285, a difference of 0.10%), British West Indian ($88,987, a difference of 0.24%), and Blackfeet ($88,717, a difference of 0.54%).
| Demographics | Rating | Rank | Median Family Income |
| Immigrants | Liberia | 0.2 /100 | #272 | Tragic $90,450 |
| Immigrants | Micronesia | 0.2 /100 | #273 | Tragic $90,345 |
| Spanish Americans | 0.2 /100 | #274 | Tragic $90,322 |
| Immigrants | St. Vincent and the Grenadines | 0.2 /100 | #275 | Tragic $90,094 |
| Immigrants | Zaire | 0.1 /100 | #276 | Tragic $89,285 |
| Immigrants | Jamaica | 0.1 /100 | #277 | Tragic $89,268 |
| Immigrants | Grenada | 0.1 /100 | #278 | Tragic $89,249 |
| Immigrants | Belize | 0.1 /100 | #279 | Tragic $89,197 |
| British West Indians | 0.1 /100 | #280 | Tragic $88,987 |
| Blackfeet | 0.1 /100 | #281 | Tragic $88,717 |
| Comanche | 0.1 /100 | #282 | Tragic $88,556 |
| Bangladeshis | 0.1 /100 | #283 | Tragic $88,358 |
| Indonesians | 0.1 /100 | #284 | Tragic $88,301 |
| Guatemalans | 0.1 /100 | #285 | Tragic $88,295 |
| Immigrants | Nicaragua | 0.1 /100 | #286 | Tragic $88,267 |