Moroccan vs Brazilian Householder Income Ages 25 - 44 years
COMPARE
Moroccan
Brazilian
Householder Income Ages 25 - 44 years
Householder Income Ages 25 - 44 years Comparison
Moroccans
Brazilians
$96,117
HOUSEHOLDER INCOME AGES 25 - 44 YEARS
70.3/ 100
METRIC RATING
155th/ 347
METRIC RANK
$98,267
HOUSEHOLDER INCOME AGES 25 - 44 YEARS
88.6/ 100
METRIC RATING
129th/ 347
METRIC RANK
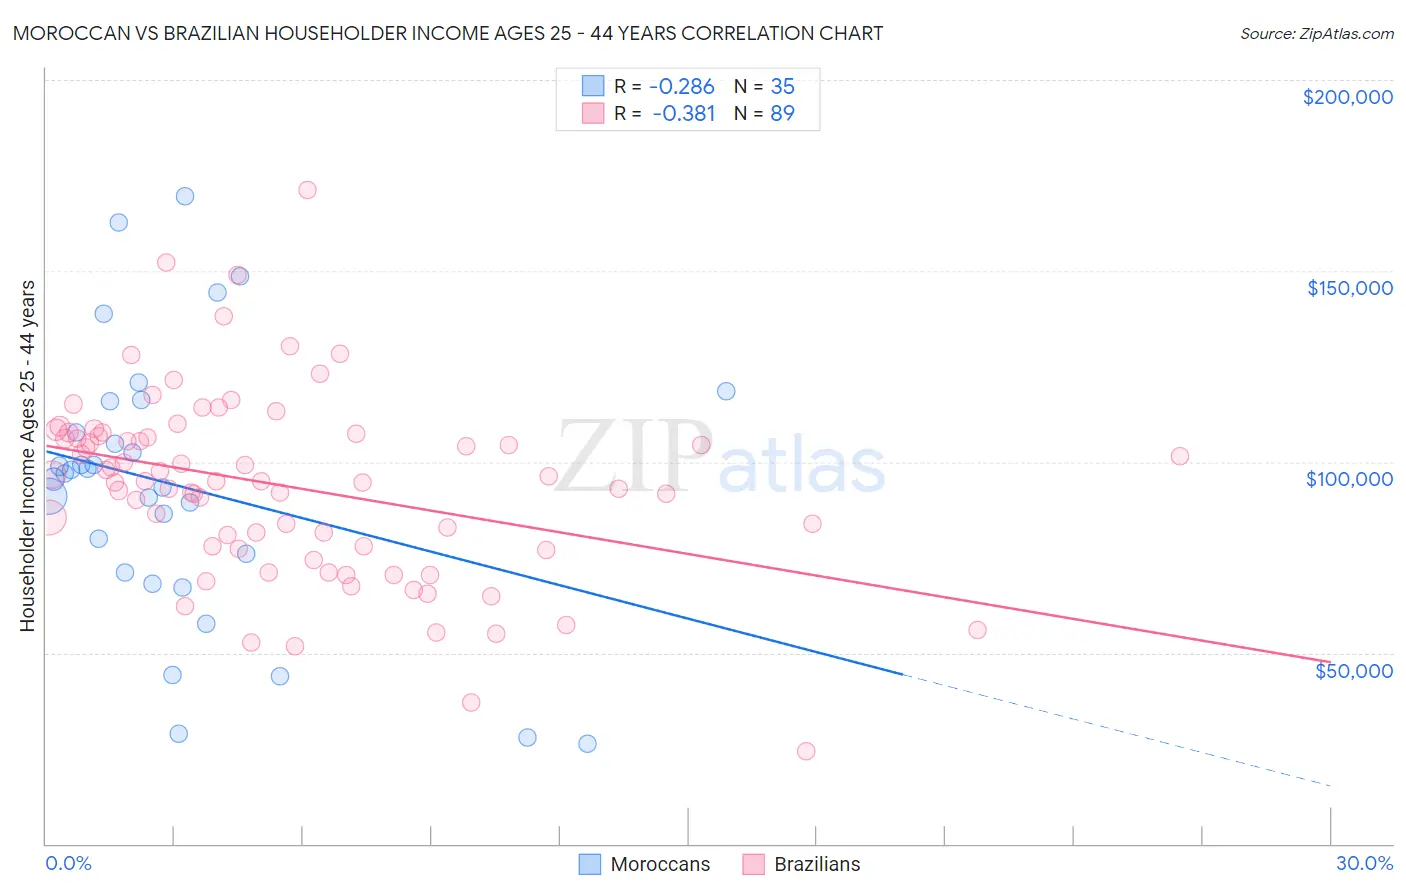
Moroccan vs Brazilian Householder Income Ages 25 - 44 years Correlation Chart
The statistical analysis conducted on geographies consisting of 201,535,372 people shows a weak negative correlation between the proportion of Moroccans and household income with householder between the ages 25 and 44 in the United States with a correlation coefficient (R) of -0.286 and weighted average of $96,117. Similarly, the statistical analysis conducted on geographies consisting of 323,332,092 people shows a mild negative correlation between the proportion of Brazilians and household income with householder between the ages 25 and 44 in the United States with a correlation coefficient (R) of -0.381 and weighted average of $98,267, a difference of 2.2%.
Householder Income Ages 25 - 44 years Correlation Summary
| Measurement | Moroccan | Brazilian |
| Minimum | $26,250 | $24,240 |
| Maximum | $169,563 | $171,042 |
| Range | $143,313 | $146,802 |
| Mean | $93,636 | $93,547 |
| Median | $96,963 | $94,950 |
| Interquartile 25% (IQ1) | $70,962 | $77,657 |
| Interquartile 75% (IQ3) | $115,732 | $107,059 |
| Interquartile Range (IQR) | $44,770 | $29,402 |
| Standard Deviation (Sample) | $35,487 | $24,480 |
| Standard Deviation (Population) | $34,976 | $24,342 |
Similar Demographics by Householder Income Ages 25 - 44 years
Demographics Similar to Moroccans by Householder Income Ages 25 - 44 years
In terms of householder income ages 25 - 44 years, the demographic groups most similar to Moroccans are Immigrants from Germany ($95,913, a difference of 0.21%), Slavic ($96,377, a difference of 0.27%), Slovene ($96,439, a difference of 0.33%), South American Indian ($96,497, a difference of 0.40%), and Czech ($96,525, a difference of 0.42%).
| Demographics | Rating | Rank | Householder Income Ages 25 - 44 years |
| Irish | 76.9 /100 | #148 | Good $96,730 |
| Basques | 76.6 /100 | #149 | Good $96,709 |
| Ugandans | 76.2 /100 | #150 | Good $96,667 |
| Czechs | 74.8 /100 | #151 | Good $96,525 |
| South American Indians | 74.5 /100 | #152 | Good $96,497 |
| Slovenes | 73.9 /100 | #153 | Good $96,439 |
| Slavs | 73.2 /100 | #154 | Good $96,377 |
| Moroccans | 70.3 /100 | #155 | Good $96,117 |
| Immigrants | Germany | 67.9 /100 | #156 | Good $95,913 |
| Immigrants | Uganda | 65.2 /100 | #157 | Good $95,698 |
| Scandinavians | 63.9 /100 | #158 | Good $95,596 |
| Costa Ricans | 63.5 /100 | #159 | Good $95,565 |
| Icelanders | 63.4 /100 | #160 | Good $95,560 |
| Immigrants | Portugal | 62.8 /100 | #161 | Good $95,512 |
| Swiss | 62.8 /100 | #162 | Good $95,511 |
Demographics Similar to Brazilians by Householder Income Ages 25 - 44 years
In terms of householder income ages 25 - 44 years, the demographic groups most similar to Brazilians are European ($98,310, a difference of 0.040%), Serbian ($98,320, a difference of 0.050%), British ($98,359, a difference of 0.090%), Pakistani ($98,401, a difference of 0.14%), and Immigrants from Kuwait ($98,122, a difference of 0.15%).
| Demographics | Rating | Rank | Householder Income Ages 25 - 44 years |
| Immigrants | Uzbekistan | 91.5 /100 | #122 | Exceptional $98,849 |
| Palestinians | 91.2 /100 | #123 | Exceptional $98,777 |
| Zimbabweans | 90.3 /100 | #124 | Exceptional $98,586 |
| Pakistanis | 89.3 /100 | #125 | Excellent $98,401 |
| British | 89.1 /100 | #126 | Excellent $98,359 |
| Serbians | 88.9 /100 | #127 | Excellent $98,320 |
| Europeans | 88.9 /100 | #128 | Excellent $98,310 |
| Brazilians | 88.6 /100 | #129 | Excellent $98,267 |
| Immigrants | Kuwait | 87.8 /100 | #130 | Excellent $98,122 |
| Immigrants | Albania | 86.6 /100 | #131 | Excellent $97,929 |
| Immigrants | Zimbabwe | 86.3 /100 | #132 | Excellent $97,880 |
| Tsimshian | 85.8 /100 | #133 | Excellent $97,809 |
| Canadians | 84.5 /100 | #134 | Excellent $97,625 |
| Immigrants | Oceania | 84.5 /100 | #135 | Excellent $97,623 |
| Hungarians | 83.9 /100 | #136 | Excellent $97,544 |