Mongolian vs Immigrants from Central America Householder Income Under 25 years
COMPARE
Mongolian
Immigrants from Central America
Householder Income Under 25 years
Householder Income Under 25 years Comparison
Mongolians
Immigrants from Central America
$52,540
HOUSEHOLDER INCOME UNDER 25 YEARS
70.2/ 100
METRIC RATING
159th/ 347
METRIC RANK
$51,022
HOUSEHOLDER INCOME UNDER 25 YEARS
5.4/ 100
METRIC RATING
227th/ 347
METRIC RANK
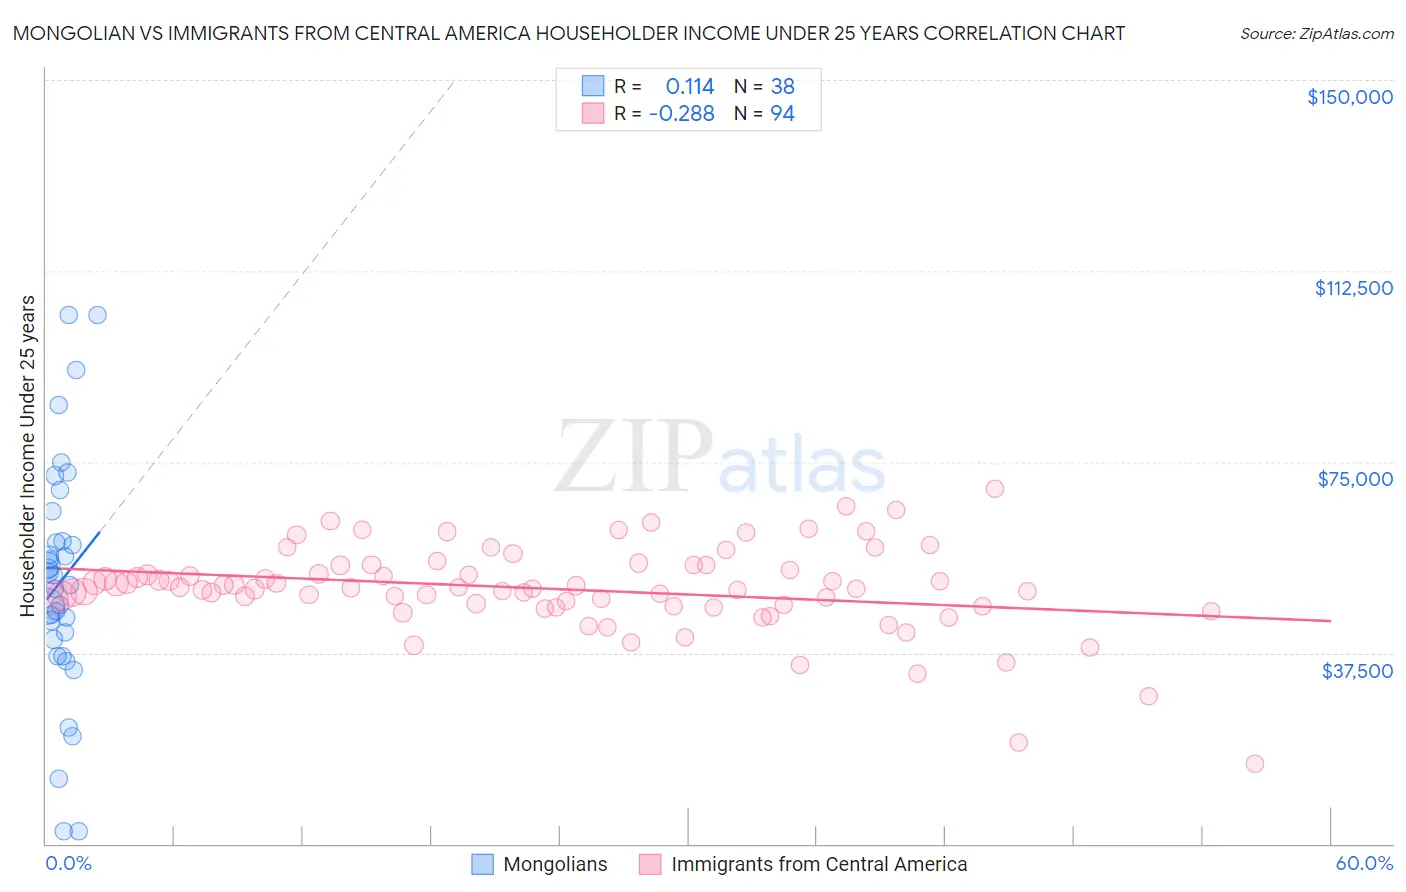
Mongolian vs Immigrants from Central America Householder Income Under 25 years Correlation Chart
The statistical analysis conducted on geographies consisting of 130,351,633 people shows a poor positive correlation between the proportion of Mongolians and household income with householder under the age of 25 in the United States with a correlation coefficient (R) of 0.114 and weighted average of $52,540. Similarly, the statistical analysis conducted on geographies consisting of 425,295,925 people shows a weak negative correlation between the proportion of Immigrants from Central America and household income with householder under the age of 25 in the United States with a correlation coefficient (R) of -0.288 and weighted average of $51,022, a difference of 3.0%.
Householder Income Under 25 years Correlation Summary
| Measurement | Mongolian | Immigrants from Central America |
| Minimum | $2,499 | $15,750 |
| Maximum | $103,839 | $69,727 |
| Range | $101,340 | $53,977 |
| Mean | $51,654 | $50,026 |
| Median | $51,754 | $50,176 |
| Interquartile 25% (IQ1) | $40,145 | $46,703 |
| Interquartile 75% (IQ3) | $59,299 | $54,624 |
| Interquartile Range (IQR) | $19,154 | $7,920 |
| Standard Deviation (Sample) | $23,318 | $8,635 |
| Standard Deviation (Population) | $23,009 | $8,589 |
Similar Demographics by Householder Income Under 25 years
Demographics Similar to Mongolians by Householder Income Under 25 years
In terms of householder income under 25 years, the demographic groups most similar to Mongolians are Immigrants from Turkey ($52,503, a difference of 0.070%), Ghanaian ($52,594, a difference of 0.10%), Immigrants from Netherlands ($52,592, a difference of 0.10%), Immigrants from Nepal ($52,611, a difference of 0.13%), and Immigrants from Denmark ($52,612, a difference of 0.14%).
| Demographics | Rating | Rank | Householder Income Under 25 years |
| Trinidadians and Tobagonians | 74.6 /100 | #152 | Good $52,631 |
| Central Americans | 74.4 /100 | #153 | Good $52,626 |
| Immigrants | Azores | 74.2 /100 | #154 | Good $52,621 |
| Immigrants | Denmark | 73.8 /100 | #155 | Good $52,612 |
| Immigrants | Nepal | 73.7 /100 | #156 | Good $52,611 |
| Ghanaians | 72.9 /100 | #157 | Good $52,594 |
| Immigrants | Netherlands | 72.8 /100 | #158 | Good $52,592 |
| Mongolians | 70.2 /100 | #159 | Good $52,540 |
| Immigrants | Turkey | 68.3 /100 | #160 | Good $52,503 |
| Uruguayans | 66.2 /100 | #161 | Good $52,465 |
| Immigrants | Cambodia | 65.4 /100 | #162 | Good $52,450 |
| Immigrants | Chile | 64.8 /100 | #163 | Good $52,440 |
| Immigrants | Trinidad and Tobago | 64.7 /100 | #164 | Good $52,437 |
| Poles | 63.0 /100 | #165 | Good $52,407 |
| Immigrants | Austria | 62.6 /100 | #166 | Good $52,400 |
Demographics Similar to Immigrants from Central America by Householder Income Under 25 years
In terms of householder income under 25 years, the demographic groups most similar to Immigrants from Central America are Yugoslavian ($51,028, a difference of 0.010%), Immigrants from Jamaica ($51,038, a difference of 0.030%), Immigrants from Norway ($50,984, a difference of 0.070%), Belizean ($51,094, a difference of 0.14%), and Serbian ($51,106, a difference of 0.16%).
| Demographics | Rating | Rank | Householder Income Under 25 years |
| Immigrants | Germany | 8.0 /100 | #220 | Tragic $51,190 |
| Immigrants | Eastern Africa | 7.4 /100 | #221 | Tragic $51,158 |
| Spaniards | 6.8 /100 | #222 | Tragic $51,117 |
| Serbians | 6.6 /100 | #223 | Tragic $51,106 |
| Belizeans | 6.4 /100 | #224 | Tragic $51,094 |
| Immigrants | Jamaica | 5.6 /100 | #225 | Tragic $51,038 |
| Yugoslavians | 5.5 /100 | #226 | Tragic $51,028 |
| Immigrants | Central America | 5.4 /100 | #227 | Tragic $51,022 |
| Immigrants | Norway | 5.0 /100 | #228 | Tragic $50,984 |
| Yuman | 4.4 /100 | #229 | Tragic $50,933 |
| Jamaicans | 4.4 /100 | #230 | Tragic $50,929 |
| Ugandans | 4.3 /100 | #231 | Tragic $50,923 |
| Slovenes | 4.0 /100 | #232 | Tragic $50,886 |
| Pennsylvania Germans | 3.7 /100 | #233 | Tragic $50,852 |
| Kenyans | 3.3 /100 | #234 | Tragic $50,815 |