Mexican vs Immigrants from Uzbekistan Doctorate Degree
COMPARE
Mexican
Immigrants from Uzbekistan
Doctorate Degree
Doctorate Degree Comparison
Mexicans
Immigrants from Uzbekistan
1.2%
DOCTORATE DEGREE
0.0/ 100
METRIC RATING
341st/ 347
METRIC RANK
2.0%
DOCTORATE DEGREE
89.3/ 100
METRIC RATING
133rd/ 347
METRIC RANK
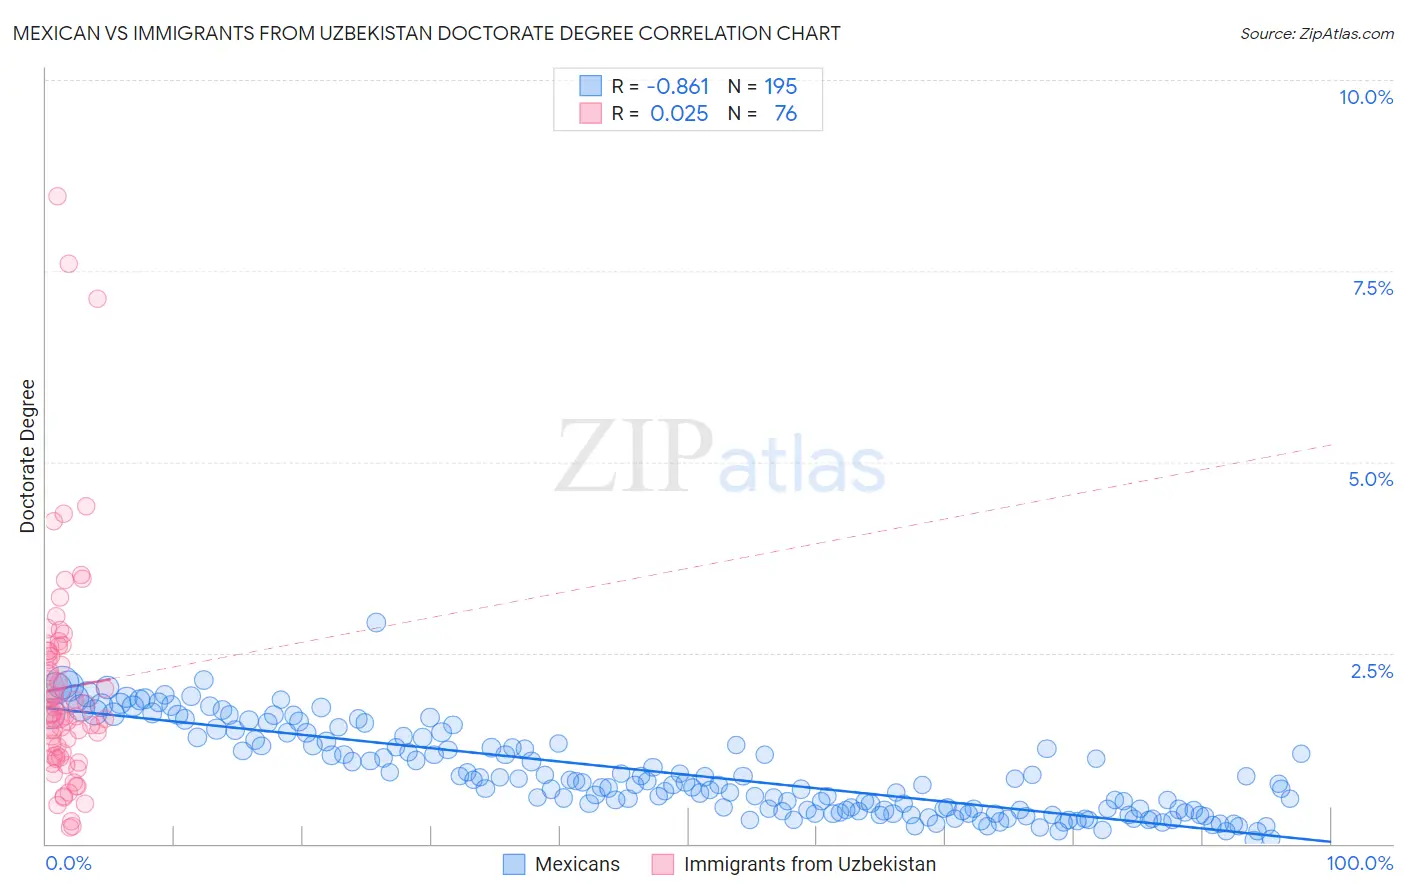
Mexican vs Immigrants from Uzbekistan Doctorate Degree Correlation Chart
The statistical analysis conducted on geographies consisting of 541,488,893 people shows a very strong negative correlation between the proportion of Mexicans and percentage of population with at least doctorate degree education in the United States with a correlation coefficient (R) of -0.861 and weighted average of 1.2%. Similarly, the statistical analysis conducted on geographies consisting of 118,602,748 people shows no correlation between the proportion of Immigrants from Uzbekistan and percentage of population with at least doctorate degree education in the United States with a correlation coefficient (R) of 0.025 and weighted average of 2.0%, a difference of 69.2%.
Doctorate Degree Correlation Summary
| Measurement | Mexican | Immigrants from Uzbekistan |
| Minimum | 0.054% | 0.21% |
| Maximum | 2.9% | 8.5% |
| Range | 2.8% | 8.3% |
| Mean | 0.92% | 2.0% |
| Median | 0.77% | 1.7% |
| Interquartile 25% (IQ1) | 0.43% | 1.1% |
| Interquartile 75% (IQ3) | 1.4% | 2.5% |
| Interquartile Range (IQR) | 0.94% | 1.4% |
| Standard Deviation (Sample) | 0.57% | 1.5% |
| Standard Deviation (Population) | 0.57% | 1.5% |
Similar Demographics by Doctorate Degree
Demographics Similar to Mexicans by Doctorate Degree
In terms of doctorate degree, the demographic groups most similar to Mexicans are Arapaho (1.2%, a difference of 0.38%), Immigrants from Cuba (1.2%, a difference of 0.48%), Immigrants from Central America (1.2%, a difference of 1.3%), Puget Sound Salish (1.2%, a difference of 2.6%), and Bangladeshi (1.2%, a difference of 3.4%).
| Demographics | Rating | Rank | Doctorate Degree |
| Immigrants | Caribbean | 0.0 /100 | #333 | Tragic 1.3% |
| Immigrants | Dominican Republic | 0.0 /100 | #334 | Tragic 1.3% |
| Immigrants | Haiti | 0.0 /100 | #335 | Tragic 1.3% |
| Nepalese | 0.0 /100 | #336 | Tragic 1.3% |
| Bangladeshis | 0.0 /100 | #337 | Tragic 1.2% |
| Puget Sound Salish | 0.0 /100 | #338 | Tragic 1.2% |
| Immigrants | Central America | 0.0 /100 | #339 | Tragic 1.2% |
| Immigrants | Cuba | 0.0 /100 | #340 | Tragic 1.2% |
| Mexicans | 0.0 /100 | #341 | Tragic 1.2% |
| Arapaho | 0.0 /100 | #342 | Tragic 1.2% |
| Fijians | 0.0 /100 | #343 | Tragic 1.1% |
| Immigrants | Mexico | 0.0 /100 | #344 | Tragic 1.1% |
| Lumbee | 0.0 /100 | #345 | Tragic 1.1% |
| Spanish American Indians | 0.0 /100 | #346 | Tragic 1.1% |
| Houma | 0.0 /100 | #347 | Tragic 0.96% |
Demographics Similar to Immigrants from Uzbekistan by Doctorate Degree
In terms of doctorate degree, the demographic groups most similar to Immigrants from Uzbekistan are Scottish (2.0%, a difference of 0.050%), Immigrants from Cameroon (2.0%, a difference of 0.15%), Serbian (2.0%, a difference of 0.21%), Immigrants from Sierra Leone (2.0%, a difference of 0.33%), and Swedish (2.0%, a difference of 0.36%).
| Demographics | Rating | Rank | Doctorate Degree |
| Jordanians | 92.1 /100 | #126 | Exceptional 2.0% |
| Palestinians | 92.0 /100 | #127 | Exceptional 2.0% |
| Immigrants | Zaire | 91.1 /100 | #128 | Exceptional 2.0% |
| Canadians | 90.6 /100 | #129 | Exceptional 2.0% |
| Immigrants | Ukraine | 90.5 /100 | #130 | Exceptional 2.0% |
| Immigrants | Sierra Leone | 90.2 /100 | #131 | Exceptional 2.0% |
| Scottish | 89.4 /100 | #132 | Excellent 2.0% |
| Immigrants | Uzbekistan | 89.3 /100 | #133 | Excellent 2.0% |
| Immigrants | Cameroon | 88.9 /100 | #134 | Excellent 2.0% |
| Serbians | 88.7 /100 | #135 | Excellent 2.0% |
| Swedes | 88.3 /100 | #136 | Excellent 2.0% |
| South American Indians | 88.3 /100 | #137 | Excellent 2.0% |
| Swiss | 88.0 /100 | #138 | Excellent 2.0% |
| Afghans | 87.2 /100 | #139 | Excellent 2.0% |
| Immigrants | Africa | 87.0 /100 | #140 | Excellent 2.0% |