Mexican vs Haitian Per Capita Income
COMPARE
Mexican
Haitian
Per Capita Income
Per Capita Income Comparison
Mexicans
Haitians
$34,559
PER CAPITA INCOME
0.0/ 100
METRIC RATING
329th/ 347
METRIC RANK
$37,289
PER CAPITA INCOME
0.1/ 100
METRIC RATING
297th/ 347
METRIC RANK
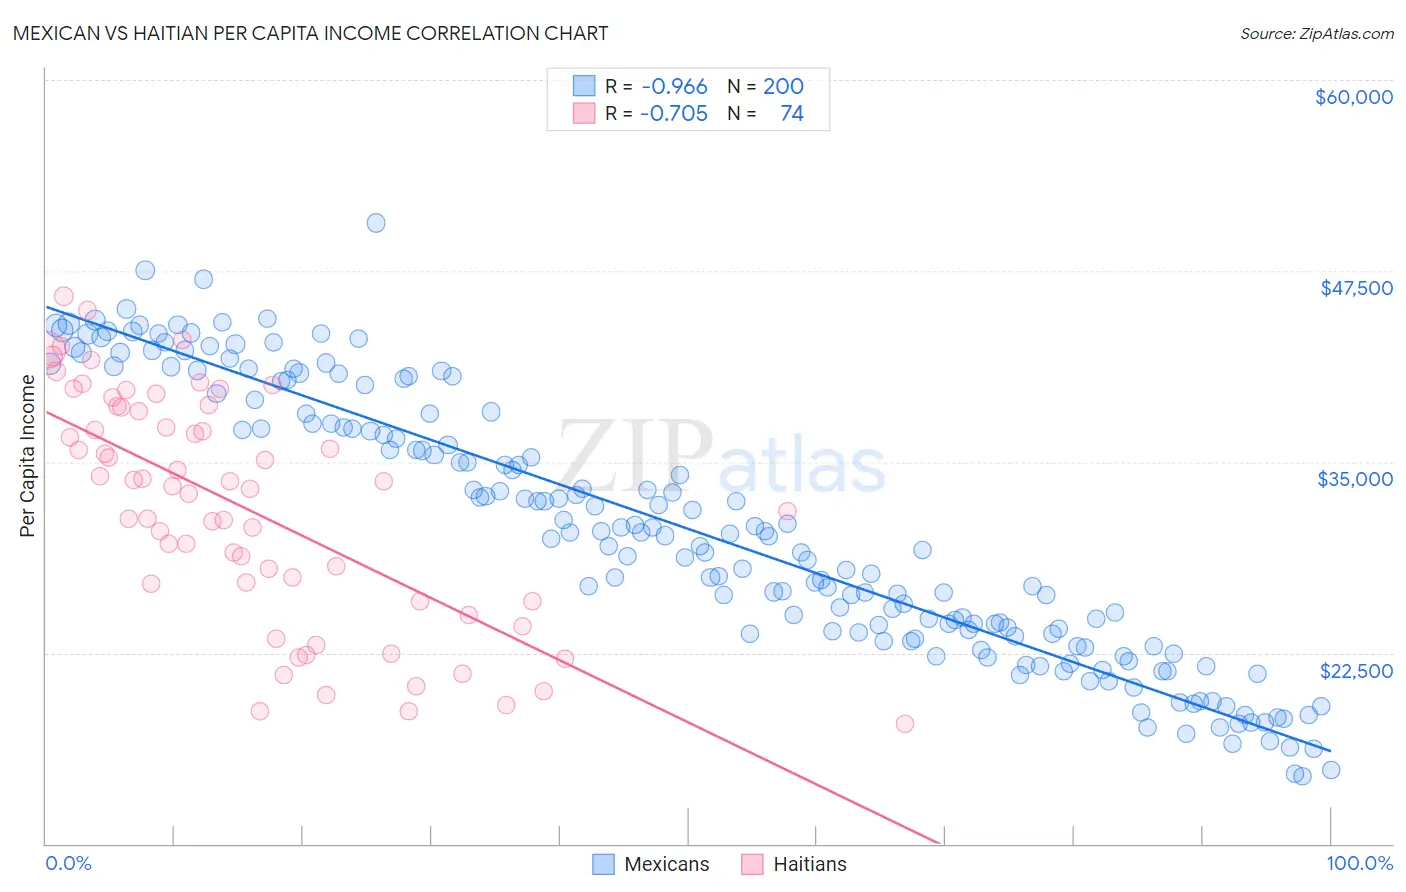
Mexican vs Haitian Per Capita Income Correlation Chart
The statistical analysis conducted on geographies consisting of 565,389,845 people shows a perfect negative correlation between the proportion of Mexicans and per capita income in the United States with a correlation coefficient (R) of -0.966 and weighted average of $34,559. Similarly, the statistical analysis conducted on geographies consisting of 288,031,086 people shows a strong negative correlation between the proportion of Haitians and per capita income in the United States with a correlation coefficient (R) of -0.705 and weighted average of $37,289, a difference of 7.9%.
Per Capita Income Correlation Summary
| Measurement | Mexican | Haitian |
| Minimum | $14,444 | $17,858 |
| Maximum | $50,649 | $45,871 |
| Range | $36,205 | $28,013 |
| Mean | $30,602 | $31,987 |
| Median | $30,143 | $33,320 |
| Interquartile 25% (IQ1) | $23,673 | $25,885 |
| Interquartile 75% (IQ3) | $38,169 | $38,541 |
| Interquartile Range (IQR) | $14,496 | $12,656 |
| Standard Deviation (Sample) | $8,722 | $7,480 |
| Standard Deviation (Population) | $8,700 | $7,429 |
Similar Demographics by Per Capita Income
Demographics Similar to Mexicans by Per Capita Income
In terms of per capita income, the demographic groups most similar to Mexicans are Menominee ($34,578, a difference of 0.060%), Apache ($34,886, a difference of 0.95%), Immigrants from Cuba ($34,910, a difference of 1.0%), Spanish American Indian ($34,195, a difference of 1.1%), and Immigrants from Central America ($34,974, a difference of 1.2%).
| Demographics | Rating | Rank | Per Capita Income |
| Creek | 0.0 /100 | #322 | Tragic $35,546 |
| Cheyenne | 0.0 /100 | #323 | Tragic $35,276 |
| Kiowa | 0.0 /100 | #324 | Tragic $35,102 |
| Immigrants | Central America | 0.0 /100 | #325 | Tragic $34,974 |
| Immigrants | Cuba | 0.0 /100 | #326 | Tragic $34,910 |
| Apache | 0.0 /100 | #327 | Tragic $34,886 |
| Menominee | 0.0 /100 | #328 | Tragic $34,578 |
| Mexicans | 0.0 /100 | #329 | Tragic $34,559 |
| Spanish American Indians | 0.0 /100 | #330 | Tragic $34,195 |
| Immigrants | Mexico | 0.0 /100 | #331 | Tragic $33,931 |
| Sioux | 0.0 /100 | #332 | Tragic $33,921 |
| Immigrants | Yemen | 0.0 /100 | #333 | Tragic $33,696 |
| Natives/Alaskans | 0.0 /100 | #334 | Tragic $33,279 |
| Yuman | 0.0 /100 | #335 | Tragic $33,236 |
| Yakama | 0.0 /100 | #336 | Tragic $33,009 |
Demographics Similar to Haitians by Per Capita Income
In terms of per capita income, the demographic groups most similar to Haitians are Indonesian ($37,300, a difference of 0.030%), Immigrants from Dominican Republic ($37,306, a difference of 0.040%), Immigrants from Caribbean ($37,254, a difference of 0.090%), Cherokee ($37,203, a difference of 0.23%), and Cuban ($37,383, a difference of 0.25%).
| Demographics | Rating | Rank | Per Capita Income |
| Immigrants | Guatemala | 0.1 /100 | #290 | Tragic $37,550 |
| Cajuns | 0.1 /100 | #291 | Tragic $37,527 |
| Immigrants | Micronesia | 0.1 /100 | #292 | Tragic $37,464 |
| Mexican American Indians | 0.1 /100 | #293 | Tragic $37,407 |
| Cubans | 0.1 /100 | #294 | Tragic $37,383 |
| Immigrants | Dominican Republic | 0.1 /100 | #295 | Tragic $37,306 |
| Indonesians | 0.1 /100 | #296 | Tragic $37,300 |
| Haitians | 0.1 /100 | #297 | Tragic $37,289 |
| Immigrants | Caribbean | 0.1 /100 | #298 | Tragic $37,254 |
| Cherokee | 0.1 /100 | #299 | Tragic $37,203 |
| Immigrants | Bahamas | 0.1 /100 | #300 | Tragic $37,193 |
| Ottawa | 0.1 /100 | #301 | Tragic $37,101 |
| Shoshone | 0.1 /100 | #302 | Tragic $37,072 |
| Paiute | 0.1 /100 | #303 | Tragic $37,066 |
| Hondurans | 0.1 /100 | #304 | Tragic $37,031 |