Mexican American Indian vs Native/Alaskan Householder Income Ages 45 - 64 years
COMPARE
Mexican American Indian
Native/Alaskan
Householder Income Ages 45 - 64 years
Householder Income Ages 45 - 64 years Comparison
Mexican American Indians
Natives/Alaskans
$90,811
HOUSEHOLDER INCOME AGES 45 - 64 YEARS
0.8/ 100
METRIC RATING
249th/ 347
METRIC RANK
$79,816
HOUSEHOLDER INCOME AGES 45 - 64 YEARS
0.0/ 100
METRIC RATING
328th/ 347
METRIC RANK
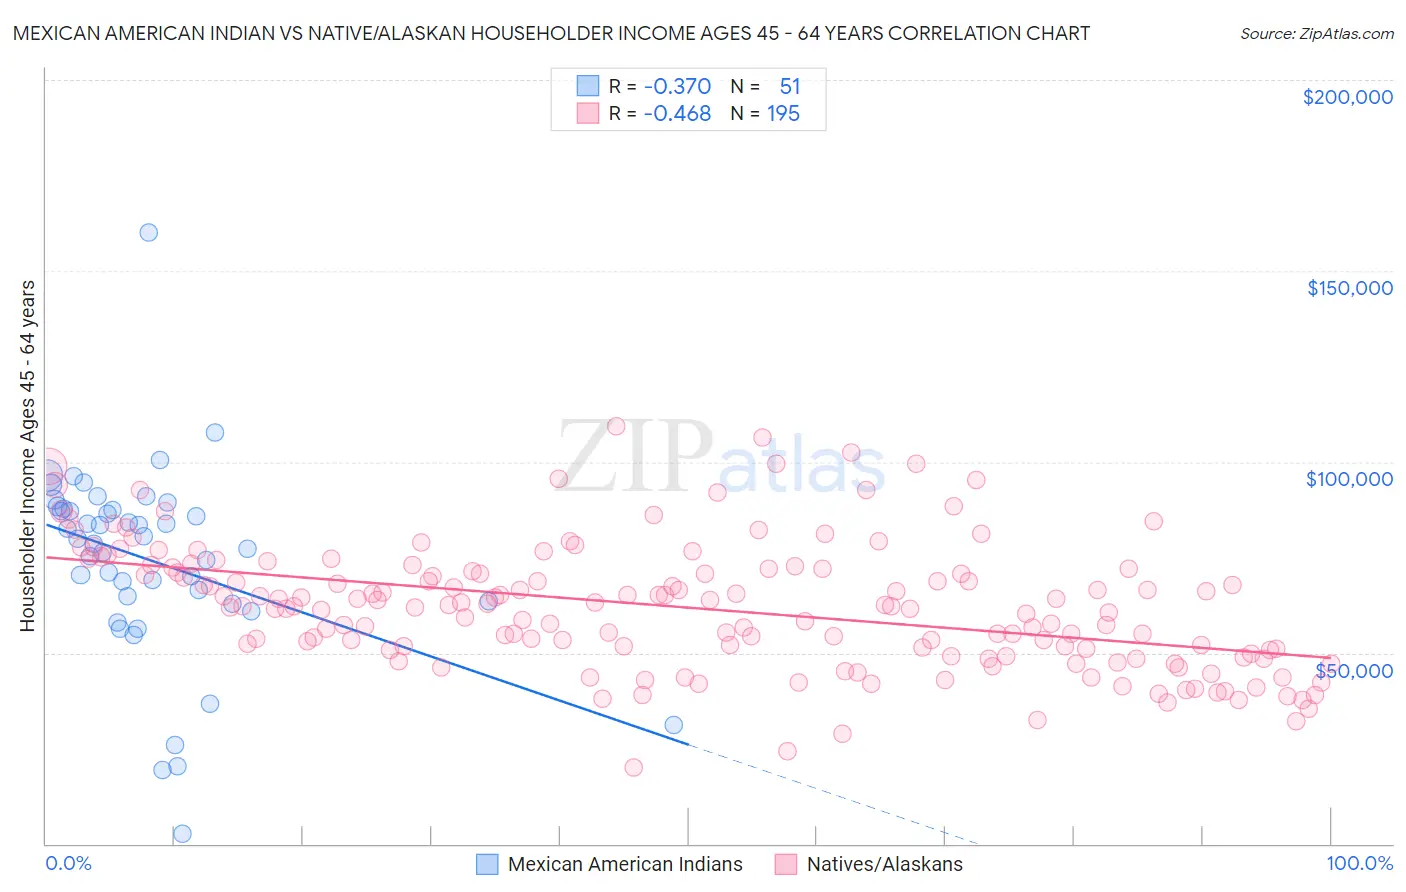
Mexican American Indian vs Native/Alaskan Householder Income Ages 45 - 64 years Correlation Chart
The statistical analysis conducted on geographies consisting of 317,180,991 people shows a mild negative correlation between the proportion of Mexican American Indians and household income with householder between the ages 45 and 64 in the United States with a correlation coefficient (R) of -0.370 and weighted average of $90,811. Similarly, the statistical analysis conducted on geographies consisting of 510,837,731 people shows a moderate negative correlation between the proportion of Natives/Alaskans and household income with householder between the ages 45 and 64 in the United States with a correlation coefficient (R) of -0.468 and weighted average of $79,816, a difference of 13.8%.
Householder Income Ages 45 - 64 years Correlation Summary
| Measurement | Mexican American Indian | Native/Alaskan |
| Minimum | $2,499 | $19,886 |
| Maximum | $160,170 | $109,193 |
| Range | $157,671 | $89,307 |
| Mean | $74,348 | $61,887 |
| Median | $79,926 | $62,067 |
| Interquartile 25% (IQ1) | $63,438 | $50,757 |
| Interquartile 75% (IQ3) | $87,647 | $72,020 |
| Interquartile Range (IQR) | $24,209 | $21,263 |
| Standard Deviation (Sample) | $25,470 | $16,443 |
| Standard Deviation (Population) | $25,219 | $16,401 |
Similar Demographics by Householder Income Ages 45 - 64 years
Demographics Similar to Mexican American Indians by Householder Income Ages 45 - 64 years
In terms of householder income ages 45 - 64 years, the demographic groups most similar to Mexican American Indians are Immigrants from Laos ($90,909, a difference of 0.11%), Subsaharan African ($90,691, a difference of 0.13%), Central American ($90,951, a difference of 0.15%), Alaskan Athabascan ($90,951, a difference of 0.15%), and Guyanese ($90,966, a difference of 0.17%).
| Demographics | Rating | Rank | Householder Income Ages 45 - 64 years |
| Inupiat | 1.1 /100 | #242 | Tragic $91,355 |
| Immigrants | Trinidad and Tobago | 1.1 /100 | #243 | Tragic $91,347 |
| Immigrants | Middle Africa | 1.1 /100 | #244 | Tragic $91,293 |
| Guyanese | 0.9 /100 | #245 | Tragic $90,966 |
| Central Americans | 0.9 /100 | #246 | Tragic $90,951 |
| Alaskan Athabascans | 0.9 /100 | #247 | Tragic $90,951 |
| Immigrants | Laos | 0.9 /100 | #248 | Tragic $90,909 |
| Mexican American Indians | 0.8 /100 | #249 | Tragic $90,811 |
| Sub-Saharan Africans | 0.8 /100 | #250 | Tragic $90,691 |
| Americans | 0.7 /100 | #251 | Tragic $90,536 |
| Marshallese | 0.7 /100 | #252 | Tragic $90,455 |
| Barbadians | 0.6 /100 | #253 | Tragic $90,266 |
| Immigrants | Guyana | 0.6 /100 | #254 | Tragic $90,186 |
| West Indians | 0.5 /100 | #255 | Tragic $89,906 |
| French American Indians | 0.5 /100 | #256 | Tragic $89,811 |
Demographics Similar to Natives/Alaskans by Householder Income Ages 45 - 64 years
In terms of householder income ages 45 - 64 years, the demographic groups most similar to Natives/Alaskans are Seminole ($80,077, a difference of 0.33%), Dutch West Indian ($79,171, a difference of 0.82%), Dominican ($80,623, a difference of 1.0%), Immigrants from Cuba ($80,662, a difference of 1.1%), and Creek ($78,960, a difference of 1.1%).
| Demographics | Rating | Rank | Householder Income Ages 45 - 64 years |
| Yuman | 0.0 /100 | #321 | Tragic $82,139 |
| Sioux | 0.0 /100 | #322 | Tragic $81,750 |
| Bahamians | 0.0 /100 | #323 | Tragic $81,369 |
| Yup'ik | 0.0 /100 | #324 | Tragic $81,000 |
| Immigrants | Cuba | 0.0 /100 | #325 | Tragic $80,662 |
| Dominicans | 0.0 /100 | #326 | Tragic $80,623 |
| Seminole | 0.0 /100 | #327 | Tragic $80,077 |
| Natives/Alaskans | 0.0 /100 | #328 | Tragic $79,816 |
| Dutch West Indians | 0.0 /100 | #329 | Tragic $79,171 |
| Creek | 0.0 /100 | #330 | Tragic $78,960 |
| Immigrants | Dominican Republic | 0.0 /100 | #331 | Tragic $78,836 |
| Blacks/African Americans | 0.0 /100 | #332 | Tragic $78,556 |
| Immigrants | Congo | 0.0 /100 | #333 | Tragic $77,850 |
| Menominee | 0.0 /100 | #334 | Tragic $76,903 |
| Cheyenne | 0.0 /100 | #335 | Tragic $76,362 |