Mexican American Indian vs Russian Householder Income Ages 45 - 64 years
COMPARE
Mexican American Indian
Russian
Householder Income Ages 45 - 64 years
Householder Income Ages 45 - 64 years Comparison
Mexican American Indians
Russians
$90,811
HOUSEHOLDER INCOME AGES 45 - 64 YEARS
0.8/ 100
METRIC RATING
249th/ 347
METRIC RANK
$116,328
HOUSEHOLDER INCOME AGES 45 - 64 YEARS
100.0/ 100
METRIC RATING
32nd/ 347
METRIC RANK
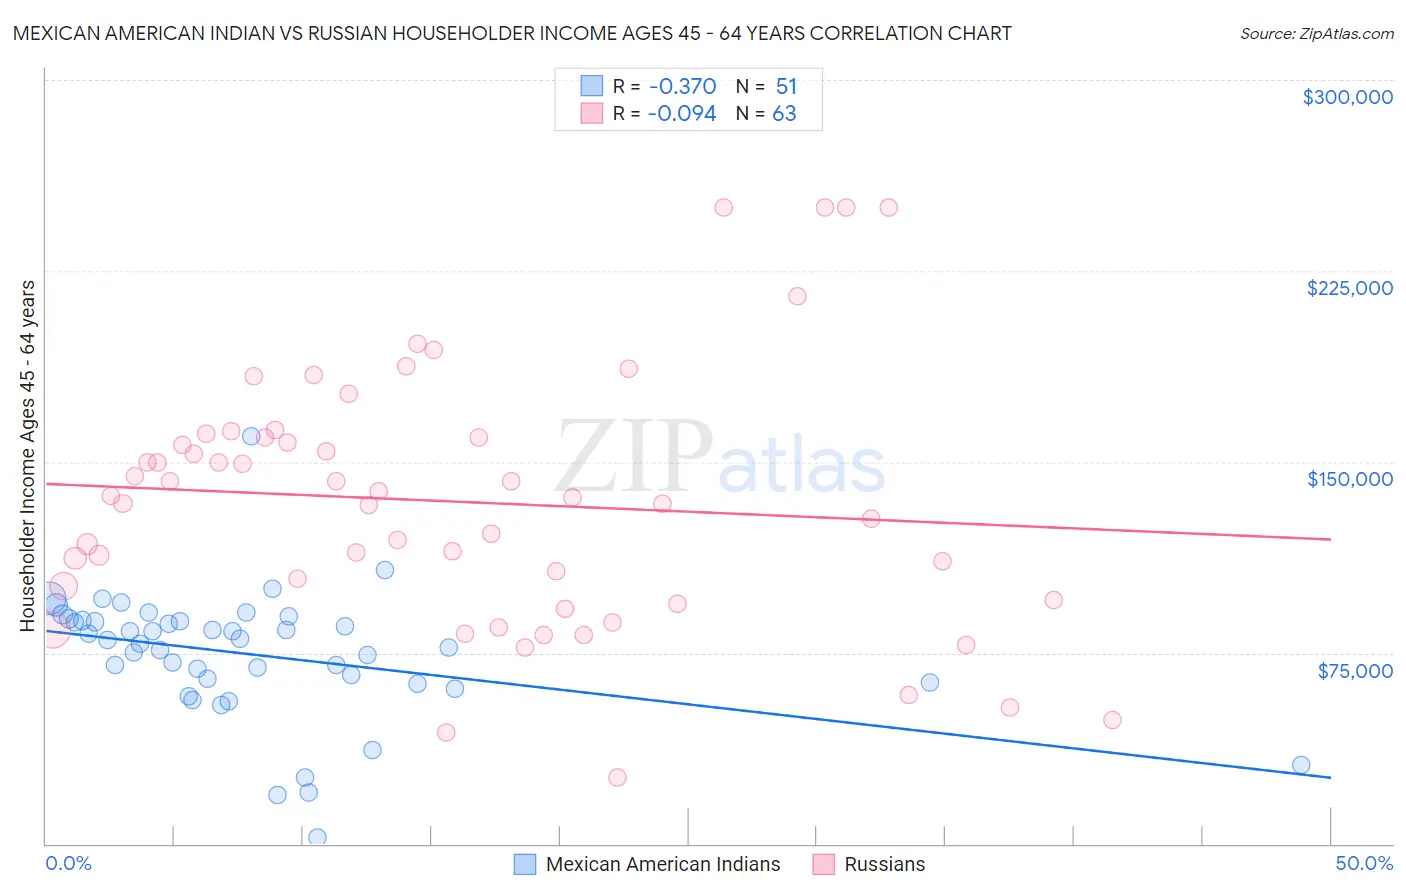
Mexican American Indian vs Russian Householder Income Ages 45 - 64 years Correlation Chart
The statistical analysis conducted on geographies consisting of 317,180,991 people shows a mild negative correlation between the proportion of Mexican American Indians and household income with householder between the ages 45 and 64 in the United States with a correlation coefficient (R) of -0.370 and weighted average of $90,811. Similarly, the statistical analysis conducted on geographies consisting of 510,398,686 people shows a slight negative correlation between the proportion of Russians and household income with householder between the ages 45 and 64 in the United States with a correlation coefficient (R) of -0.094 and weighted average of $116,328, a difference of 28.1%.
Householder Income Ages 45 - 64 years Correlation Summary
| Measurement | Mexican American Indian | Russian |
| Minimum | $2,499 | $26,250 |
| Maximum | $160,170 | $250,001 |
| Range | $157,671 | $223,751 |
| Mean | $74,348 | $134,377 |
| Median | $79,926 | $136,249 |
| Interquartile 25% (IQ1) | $63,438 | $95,750 |
| Interquartile 75% (IQ3) | $87,647 | $159,669 |
| Interquartile Range (IQR) | $24,209 | $63,919 |
| Standard Deviation (Sample) | $25,470 | $50,536 |
| Standard Deviation (Population) | $25,219 | $50,133 |
Similar Demographics by Householder Income Ages 45 - 64 years
Demographics Similar to Mexican American Indians by Householder Income Ages 45 - 64 years
In terms of householder income ages 45 - 64 years, the demographic groups most similar to Mexican American Indians are Immigrants from Laos ($90,909, a difference of 0.11%), Subsaharan African ($90,691, a difference of 0.13%), Central American ($90,951, a difference of 0.15%), Alaskan Athabascan ($90,951, a difference of 0.15%), and Guyanese ($90,966, a difference of 0.17%).
| Demographics | Rating | Rank | Householder Income Ages 45 - 64 years |
| Inupiat | 1.1 /100 | #242 | Tragic $91,355 |
| Immigrants | Trinidad and Tobago | 1.1 /100 | #243 | Tragic $91,347 |
| Immigrants | Middle Africa | 1.1 /100 | #244 | Tragic $91,293 |
| Guyanese | 0.9 /100 | #245 | Tragic $90,966 |
| Central Americans | 0.9 /100 | #246 | Tragic $90,951 |
| Alaskan Athabascans | 0.9 /100 | #247 | Tragic $90,951 |
| Immigrants | Laos | 0.9 /100 | #248 | Tragic $90,909 |
| Mexican American Indians | 0.8 /100 | #249 | Tragic $90,811 |
| Sub-Saharan Africans | 0.8 /100 | #250 | Tragic $90,691 |
| Americans | 0.7 /100 | #251 | Tragic $90,536 |
| Marshallese | 0.7 /100 | #252 | Tragic $90,455 |
| Barbadians | 0.6 /100 | #253 | Tragic $90,266 |
| Immigrants | Guyana | 0.6 /100 | #254 | Tragic $90,186 |
| West Indians | 0.5 /100 | #255 | Tragic $89,906 |
| French American Indians | 0.5 /100 | #256 | Tragic $89,811 |
Demographics Similar to Russians by Householder Income Ages 45 - 64 years
In terms of householder income ages 45 - 64 years, the demographic groups most similar to Russians are Chinese ($116,156, a difference of 0.15%), Immigrants from Asia ($116,566, a difference of 0.20%), Immigrants from Denmark ($116,000, a difference of 0.28%), Latvian ($115,957, a difference of 0.32%), and Immigrants from Switzerland ($115,934, a difference of 0.34%).
| Demographics | Rating | Rank | Householder Income Ages 45 - 64 years |
| Asians | 100.0 /100 | #25 | Exceptional $118,426 |
| Immigrants | Sweden | 100.0 /100 | #26 | Exceptional $118,318 |
| Immigrants | Northern Europe | 100.0 /100 | #27 | Exceptional $117,930 |
| Turks | 100.0 /100 | #28 | Exceptional $117,814 |
| Bhutanese | 100.0 /100 | #29 | Exceptional $117,750 |
| Immigrants | Bolivia | 100.0 /100 | #30 | Exceptional $117,731 |
| Immigrants | Asia | 100.0 /100 | #31 | Exceptional $116,566 |
| Russians | 100.0 /100 | #32 | Exceptional $116,328 |
| Chinese | 100.0 /100 | #33 | Exceptional $116,156 |
| Immigrants | Denmark | 100.0 /100 | #34 | Exceptional $116,000 |
| Latvians | 100.0 /100 | #35 | Exceptional $115,957 |
| Immigrants | Switzerland | 100.0 /100 | #36 | Exceptional $115,934 |
| Maltese | 99.9 /100 | #37 | Exceptional $114,754 |
| Immigrants | Pakistan | 99.9 /100 | #38 | Exceptional $114,434 |
| Immigrants | Turkey | 99.9 /100 | #39 | Exceptional $114,407 |