Guatemalan vs Native/Alaskan Householder Income Ages 45 - 64 years
COMPARE
Guatemalan
Native/Alaskan
Householder Income Ages 45 - 64 years
Householder Income Ages 45 - 64 years Comparison
Guatemalans
Natives/Alaskans
$87,705
HOUSEHOLDER INCOME AGES 45 - 64 YEARS
0.2/ 100
METRIC RATING
271st/ 347
METRIC RANK
$79,816
HOUSEHOLDER INCOME AGES 45 - 64 YEARS
0.0/ 100
METRIC RATING
328th/ 347
METRIC RANK
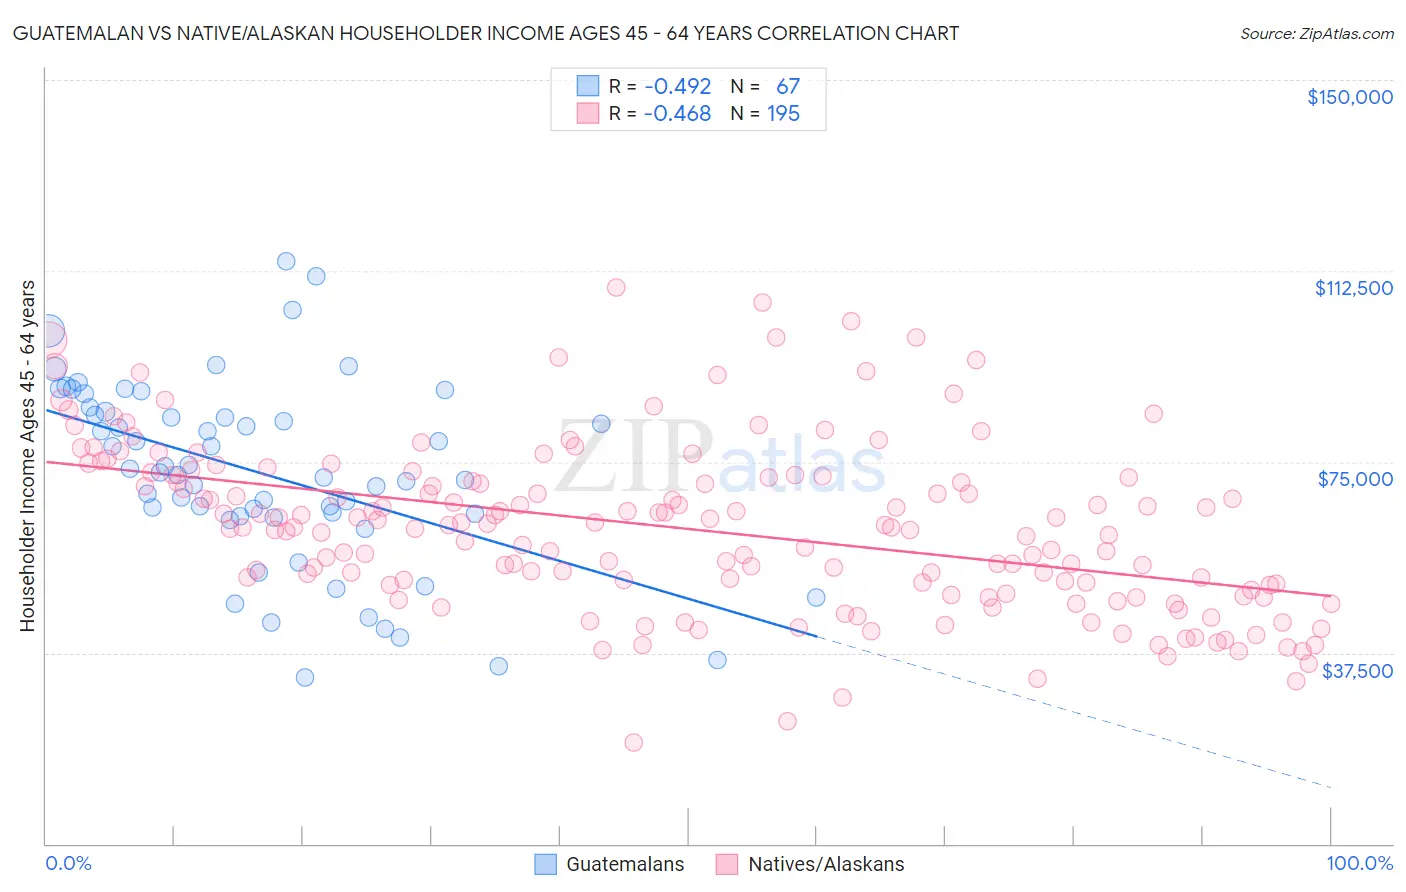
Guatemalan vs Native/Alaskan Householder Income Ages 45 - 64 years Correlation Chart
The statistical analysis conducted on geographies consisting of 408,736,377 people shows a moderate negative correlation between the proportion of Guatemalans and household income with householder between the ages 45 and 64 in the United States with a correlation coefficient (R) of -0.492 and weighted average of $87,705. Similarly, the statistical analysis conducted on geographies consisting of 510,837,731 people shows a moderate negative correlation between the proportion of Natives/Alaskans and household income with householder between the ages 45 and 64 in the United States with a correlation coefficient (R) of -0.468 and weighted average of $79,816, a difference of 9.9%.
Householder Income Ages 45 - 64 years Correlation Summary
| Measurement | Guatemalan | Native/Alaskan |
| Minimum | $32,665 | $19,886 |
| Maximum | $114,444 | $109,193 |
| Range | $81,779 | $89,307 |
| Mean | $72,782 | $61,887 |
| Median | $72,945 | $62,067 |
| Interquartile 25% (IQ1) | $64,395 | $50,757 |
| Interquartile 75% (IQ3) | $84,870 | $72,020 |
| Interquartile Range (IQR) | $20,474 | $21,263 |
| Standard Deviation (Sample) | $18,098 | $16,443 |
| Standard Deviation (Population) | $17,962 | $16,401 |
Similar Demographics by Householder Income Ages 45 - 64 years
Demographics Similar to Guatemalans by Householder Income Ages 45 - 64 years
In terms of householder income ages 45 - 64 years, the demographic groups most similar to Guatemalans are Immigrants from Liberia ($87,739, a difference of 0.040%), Cape Verdean ($87,580, a difference of 0.14%), Spanish American ($87,836, a difference of 0.15%), Spanish American Indian ($87,561, a difference of 0.16%), and Immigrants from Micronesia ($87,864, a difference of 0.18%).
| Demographics | Rating | Rank | Householder Income Ages 45 - 64 years |
| Osage | 0.3 /100 | #264 | Tragic $88,390 |
| Jamaicans | 0.2 /100 | #265 | Tragic $88,327 |
| Immigrants | West Indies | 0.2 /100 | #266 | Tragic $88,164 |
| Hmong | 0.2 /100 | #267 | Tragic $88,115 |
| Immigrants | Micronesia | 0.2 /100 | #268 | Tragic $87,864 |
| Spanish Americans | 0.2 /100 | #269 | Tragic $87,836 |
| Immigrants | Liberia | 0.2 /100 | #270 | Tragic $87,739 |
| Guatemalans | 0.2 /100 | #271 | Tragic $87,705 |
| Cape Verdeans | 0.2 /100 | #272 | Tragic $87,580 |
| Spanish American Indians | 0.2 /100 | #273 | Tragic $87,561 |
| Iroquois | 0.1 /100 | #274 | Tragic $87,255 |
| Immigrants | Belize | 0.1 /100 | #275 | Tragic $87,229 |
| Immigrants | Latin America | 0.1 /100 | #276 | Tragic $87,219 |
| Cree | 0.1 /100 | #277 | Tragic $87,185 |
| Immigrants | Jamaica | 0.1 /100 | #278 | Tragic $87,035 |
Demographics Similar to Natives/Alaskans by Householder Income Ages 45 - 64 years
In terms of householder income ages 45 - 64 years, the demographic groups most similar to Natives/Alaskans are Seminole ($80,077, a difference of 0.33%), Dutch West Indian ($79,171, a difference of 0.82%), Dominican ($80,623, a difference of 1.0%), Immigrants from Cuba ($80,662, a difference of 1.1%), and Creek ($78,960, a difference of 1.1%).
| Demographics | Rating | Rank | Householder Income Ages 45 - 64 years |
| Yuman | 0.0 /100 | #321 | Tragic $82,139 |
| Sioux | 0.0 /100 | #322 | Tragic $81,750 |
| Bahamians | 0.0 /100 | #323 | Tragic $81,369 |
| Yup'ik | 0.0 /100 | #324 | Tragic $81,000 |
| Immigrants | Cuba | 0.0 /100 | #325 | Tragic $80,662 |
| Dominicans | 0.0 /100 | #326 | Tragic $80,623 |
| Seminole | 0.0 /100 | #327 | Tragic $80,077 |
| Natives/Alaskans | 0.0 /100 | #328 | Tragic $79,816 |
| Dutch West Indians | 0.0 /100 | #329 | Tragic $79,171 |
| Creek | 0.0 /100 | #330 | Tragic $78,960 |
| Immigrants | Dominican Republic | 0.0 /100 | #331 | Tragic $78,836 |
| Blacks/African Americans | 0.0 /100 | #332 | Tragic $78,556 |
| Immigrants | Congo | 0.0 /100 | #333 | Tragic $77,850 |
| Menominee | 0.0 /100 | #334 | Tragic $76,903 |
| Cheyenne | 0.0 /100 | #335 | Tragic $76,362 |