Mexican American Indian vs Spanish American Householder Income Ages 45 - 64 years
COMPARE
Mexican American Indian
Spanish American
Householder Income Ages 45 - 64 years
Householder Income Ages 45 - 64 years Comparison
Mexican American Indians
Spanish Americans
$90,811
HOUSEHOLDER INCOME AGES 45 - 64 YEARS
0.8/ 100
METRIC RATING
249th/ 347
METRIC RANK
$87,836
HOUSEHOLDER INCOME AGES 45 - 64 YEARS
0.2/ 100
METRIC RATING
269th/ 347
METRIC RANK
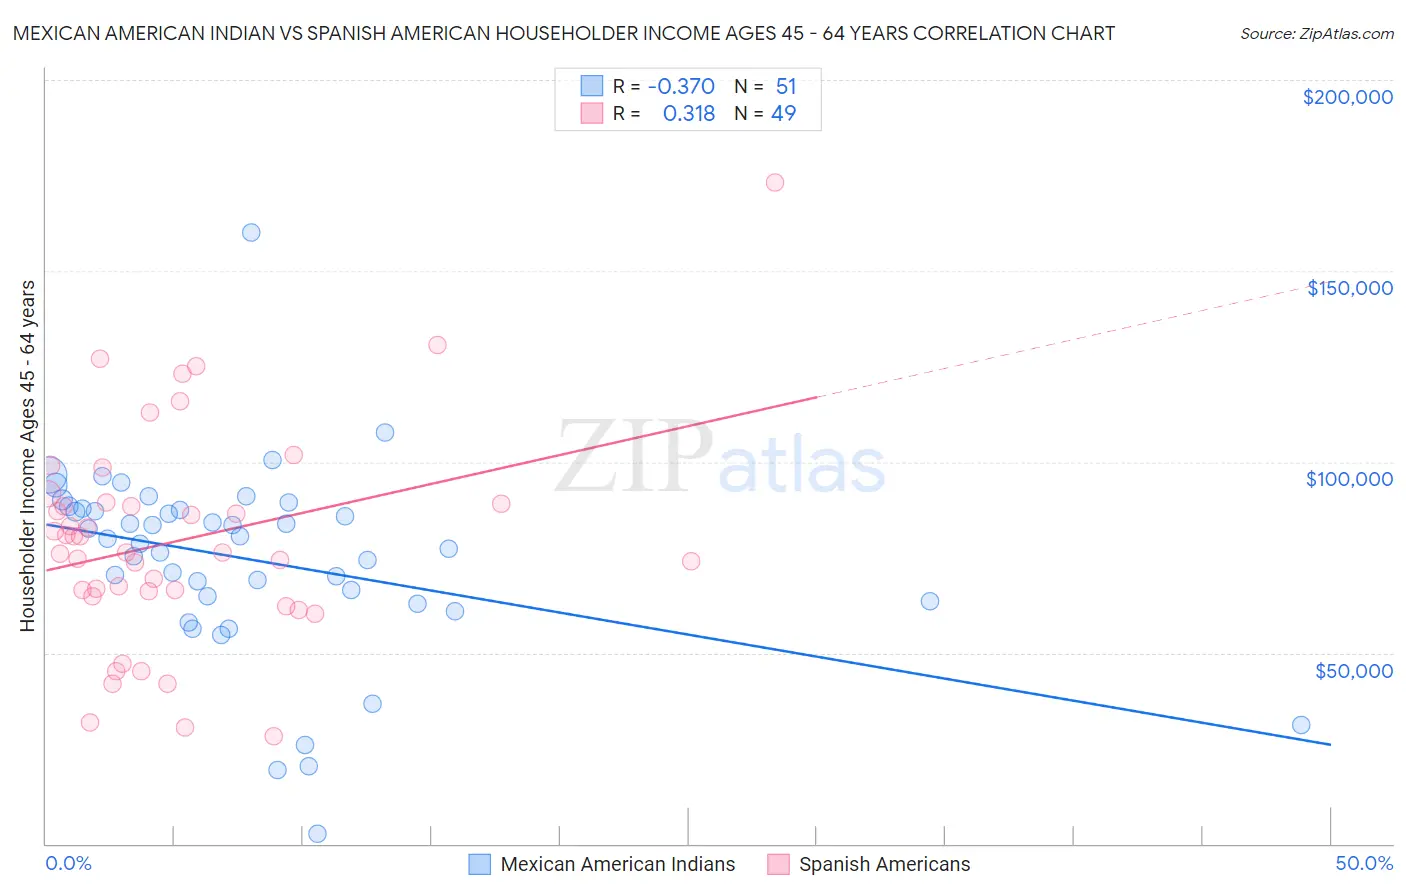
Mexican American Indian vs Spanish American Householder Income Ages 45 - 64 years Correlation Chart
The statistical analysis conducted on geographies consisting of 317,180,991 people shows a mild negative correlation between the proportion of Mexican American Indians and household income with householder between the ages 45 and 64 in the United States with a correlation coefficient (R) of -0.370 and weighted average of $90,811. Similarly, the statistical analysis conducted on geographies consisting of 103,142,376 people shows a mild positive correlation between the proportion of Spanish Americans and household income with householder between the ages 45 and 64 in the United States with a correlation coefficient (R) of 0.318 and weighted average of $87,836, a difference of 3.4%.
Householder Income Ages 45 - 64 years Correlation Summary
| Measurement | Mexican American Indian | Spanish American |
| Minimum | $2,499 | $28,021 |
| Maximum | $160,170 | $173,295 |
| Range | $157,671 | $145,274 |
| Mean | $74,348 | $79,401 |
| Median | $79,926 | $76,250 |
| Interquartile 25% (IQ1) | $63,438 | $65,439 |
| Interquartile 75% (IQ3) | $87,647 | $89,172 |
| Interquartile Range (IQR) | $24,209 | $23,734 |
| Standard Deviation (Sample) | $25,470 | $28,080 |
| Standard Deviation (Population) | $25,219 | $27,792 |
Demographics Similar to Mexican American Indians and Spanish Americans by Householder Income Ages 45 - 64 years
In terms of householder income ages 45 - 64 years, the demographic groups most similar to Mexican American Indians are Subsaharan African ($90,691, a difference of 0.13%), American ($90,536, a difference of 0.30%), Marshallese ($90,455, a difference of 0.39%), Barbadian ($90,266, a difference of 0.60%), and Immigrants from Guyana ($90,186, a difference of 0.69%). Similarly, the demographic groups most similar to Spanish Americans are Immigrants from Micronesia ($87,864, a difference of 0.030%), Hmong ($88,115, a difference of 0.32%), Immigrants from West Indies ($88,164, a difference of 0.37%), Jamaican ($88,327, a difference of 0.56%), and Osage ($88,390, a difference of 0.63%).
| Demographics | Rating | Rank | Householder Income Ages 45 - 64 years |
| Mexican American Indians | 0.8 /100 | #249 | Tragic $90,811 |
| Sub-Saharan Africans | 0.8 /100 | #250 | Tragic $90,691 |
| Americans | 0.7 /100 | #251 | Tragic $90,536 |
| Marshallese | 0.7 /100 | #252 | Tragic $90,455 |
| Barbadians | 0.6 /100 | #253 | Tragic $90,266 |
| Immigrants | Guyana | 0.6 /100 | #254 | Tragic $90,186 |
| West Indians | 0.5 /100 | #255 | Tragic $89,906 |
| French American Indians | 0.5 /100 | #256 | Tragic $89,811 |
| German Russians | 0.4 /100 | #257 | Tragic $89,398 |
| Immigrants | Barbados | 0.4 /100 | #258 | Tragic $89,394 |
| Immigrants | Nicaragua | 0.4 /100 | #259 | Tragic $89,108 |
| Liberians | 0.3 /100 | #260 | Tragic $88,929 |
| Belizeans | 0.3 /100 | #261 | Tragic $88,684 |
| Somalis | 0.3 /100 | #262 | Tragic $88,600 |
| Immigrants | Senegal | 0.3 /100 | #263 | Tragic $88,421 |
| Osage | 0.3 /100 | #264 | Tragic $88,390 |
| Jamaicans | 0.2 /100 | #265 | Tragic $88,327 |
| Immigrants | West Indies | 0.2 /100 | #266 | Tragic $88,164 |
| Hmong | 0.2 /100 | #267 | Tragic $88,115 |
| Immigrants | Micronesia | 0.2 /100 | #268 | Tragic $87,864 |
| Spanish Americans | 0.2 /100 | #269 | Tragic $87,836 |