Mexican American Indian vs Scandinavian Householder Income Over 65 years
COMPARE
Mexican American Indian
Scandinavian
Householder Income Over 65 years
Householder Income Over 65 years Comparison
Mexican American Indians
Scandinavians
$56,089
HOUSEHOLDER INCOME OVER 65 YEARS
0.6/ 100
METRIC RATING
249th/ 347
METRIC RANK
$61,586
HOUSEHOLDER INCOME OVER 65 YEARS
65.6/ 100
METRIC RATING
156th/ 347
METRIC RANK
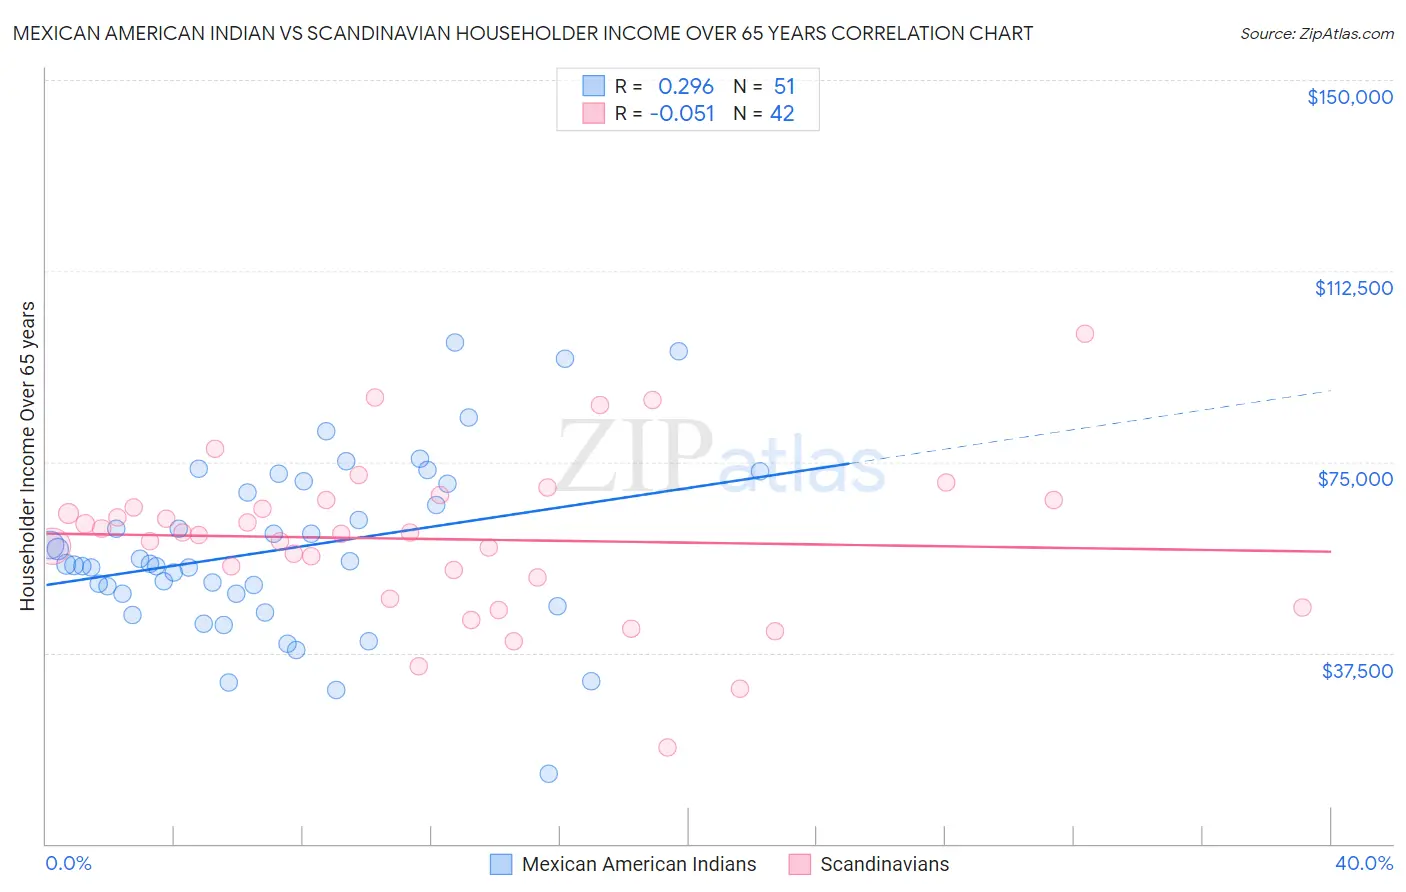
Mexican American Indian vs Scandinavian Householder Income Over 65 years Correlation Chart
The statistical analysis conducted on geographies consisting of 316,694,324 people shows a weak positive correlation between the proportion of Mexican American Indians and household income with householder over the age of 65 in the United States with a correlation coefficient (R) of 0.296 and weighted average of $56,089. Similarly, the statistical analysis conducted on geographies consisting of 470,228,291 people shows a slight negative correlation between the proportion of Scandinavians and household income with householder over the age of 65 in the United States with a correlation coefficient (R) of -0.051 and weighted average of $61,586, a difference of 9.8%.
Householder Income Over 65 years Correlation Summary
| Measurement | Mexican American Indian | Scandinavian |
| Minimum | $13,750 | $18,992 |
| Maximum | $98,333 | $100,104 |
| Range | $84,583 | $81,112 |
| Mean | $57,833 | $59,842 |
| Median | $54,877 | $60,960 |
| Interquartile 25% (IQ1) | $48,998 | $52,396 |
| Interquartile 75% (IQ3) | $70,643 | $67,455 |
| Interquartile Range (IQR) | $21,645 | $15,058 |
| Standard Deviation (Sample) | $16,994 | $15,633 |
| Standard Deviation (Population) | $16,827 | $15,446 |
Similar Demographics by Householder Income Over 65 years
Demographics Similar to Mexican American Indians by Householder Income Over 65 years
In terms of householder income over 65 years, the demographic groups most similar to Mexican American Indians are Vietnamese ($56,143, a difference of 0.10%), Immigrants from Bosnia and Herzegovina ($55,986, a difference of 0.19%), Yakama ($56,234, a difference of 0.26%), Immigrants from Portugal ($55,924, a difference of 0.30%), and Central American ($56,321, a difference of 0.41%).
| Demographics | Rating | Rank | Householder Income Over 65 years |
| Yaqui | 0.8 /100 | #242 | Tragic $56,417 |
| Guyanese | 0.8 /100 | #243 | Tragic $56,351 |
| Hmong | 0.8 /100 | #244 | Tragic $56,339 |
| Immigrants | Uzbekistan | 0.8 /100 | #245 | Tragic $56,331 |
| Central Americans | 0.8 /100 | #246 | Tragic $56,321 |
| Yakama | 0.7 /100 | #247 | Tragic $56,234 |
| Vietnamese | 0.6 /100 | #248 | Tragic $56,143 |
| Mexican American Indians | 0.6 /100 | #249 | Tragic $56,089 |
| Immigrants | Bosnia and Herzegovina | 0.5 /100 | #250 | Tragic $55,986 |
| Immigrants | Portugal | 0.5 /100 | #251 | Tragic $55,924 |
| Osage | 0.4 /100 | #252 | Tragic $55,677 |
| Immigrants | Trinidad and Tobago | 0.4 /100 | #253 | Tragic $55,598 |
| Americans | 0.3 /100 | #254 | Tragic $55,527 |
| Immigrants | Bangladesh | 0.3 /100 | #255 | Tragic $55,394 |
| German Russians | 0.3 /100 | #256 | Tragic $55,356 |
Demographics Similar to Scandinavians by Householder Income Over 65 years
In terms of householder income over 65 years, the demographic groups most similar to Scandinavians are Polish ($61,598, a difference of 0.020%), Macedonian ($61,564, a difference of 0.040%), Swiss ($61,621, a difference of 0.060%), Costa Rican ($61,638, a difference of 0.080%), and Armenian ($61,656, a difference of 0.11%).
| Demographics | Rating | Rank | Householder Income Over 65 years |
| Scottish | 69.1 /100 | #149 | Good $61,735 |
| Slavs | 68.5 /100 | #150 | Good $61,709 |
| Hungarians | 67.7 /100 | #151 | Good $61,673 |
| Armenians | 67.3 /100 | #152 | Good $61,656 |
| Costa Ricans | 66.9 /100 | #153 | Good $61,638 |
| Swiss | 66.5 /100 | #154 | Good $61,621 |
| Poles | 65.9 /100 | #155 | Good $61,598 |
| Scandinavians | 65.6 /100 | #156 | Good $61,586 |
| Macedonians | 65.1 /100 | #157 | Good $61,564 |
| English | 63.3 /100 | #158 | Good $61,487 |
| Brazilians | 62.7 /100 | #159 | Good $61,465 |
| Portuguese | 62.1 /100 | #160 | Good $61,440 |
| Icelanders | 57.9 /100 | #161 | Average $61,270 |
| Czechs | 57.2 /100 | #162 | Average $61,244 |
| Ugandans | 55.5 /100 | #163 | Average $61,177 |