Immigrants from Guatemala vs Immigrants from Thailand Householder Income Over 65 years
COMPARE
Immigrants from Guatemala
Immigrants from Thailand
Householder Income Over 65 years
Householder Income Over 65 years Comparison
Immigrants from Guatemala
Immigrants from Thailand
$53,950
HOUSEHOLDER INCOME OVER 65 YEARS
0.1/ 100
METRIC RATING
284th/ 347
METRIC RANK
$60,217
HOUSEHOLDER INCOME OVER 65 YEARS
31.3/ 100
METRIC RATING
187th/ 347
METRIC RANK
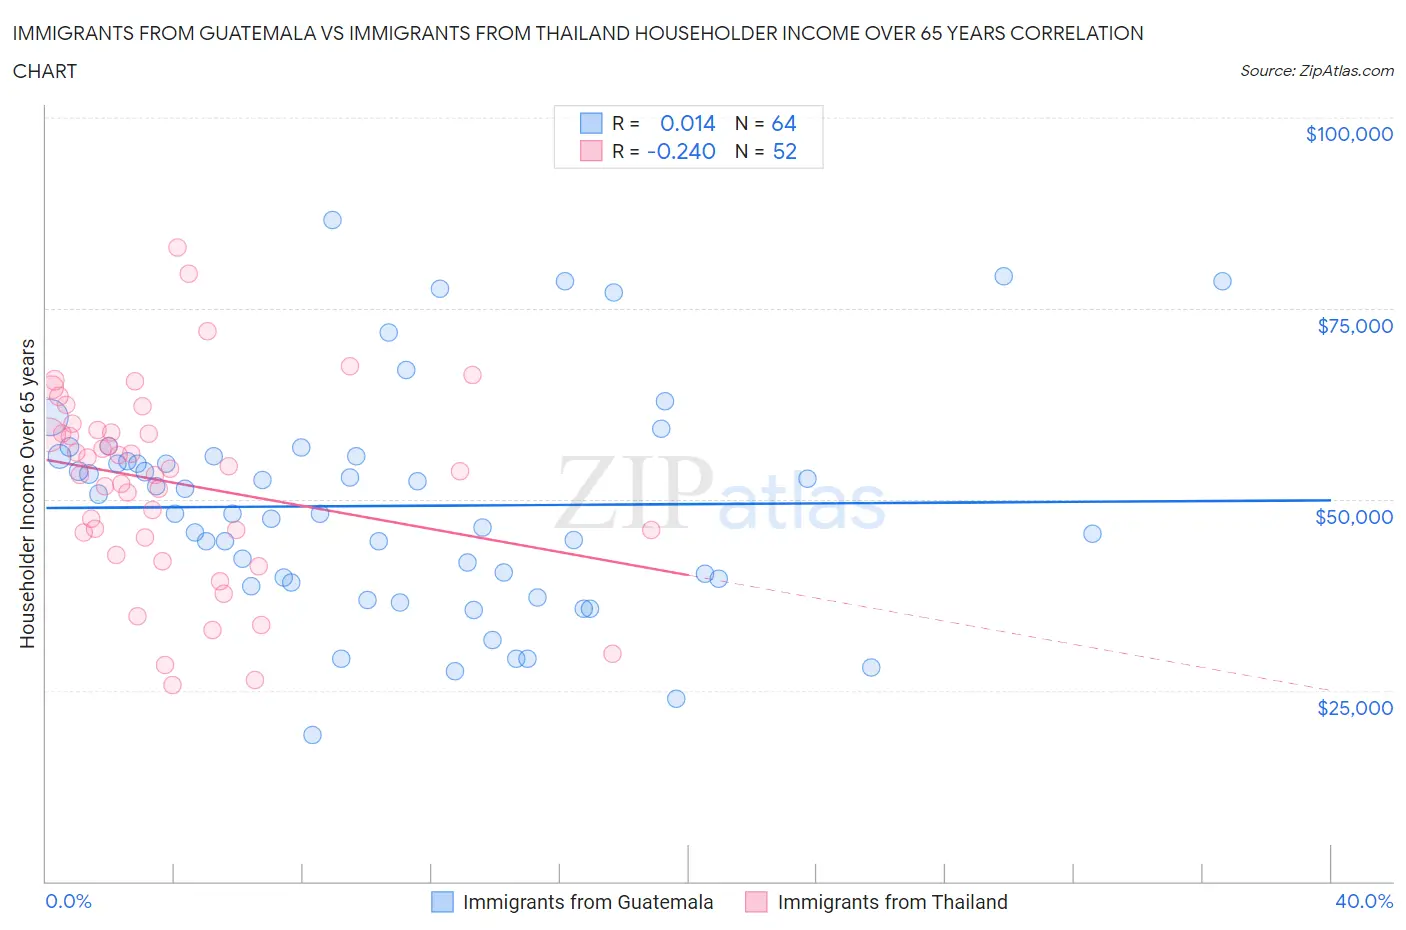
Immigrants from Guatemala vs Immigrants from Thailand Householder Income Over 65 years Correlation Chart
The statistical analysis conducted on geographies consisting of 376,354,988 people shows no correlation between the proportion of Immigrants from Guatemala and household income with householder over the age of 65 in the United States with a correlation coefficient (R) of 0.014 and weighted average of $53,950. Similarly, the statistical analysis conducted on geographies consisting of 316,391,509 people shows a weak negative correlation between the proportion of Immigrants from Thailand and household income with householder over the age of 65 in the United States with a correlation coefficient (R) of -0.240 and weighted average of $60,217, a difference of 11.6%.
Householder Income Over 65 years Correlation Summary
| Measurement | Immigrants from Guatemala | Immigrants from Thailand |
| Minimum | $19,196 | $25,625 |
| Maximum | $86,499 | $83,060 |
| Range | $67,303 | $57,435 |
| Mean | $49,149 | $52,191 |
| Median | $48,160 | $53,828 |
| Interquartile 25% (IQ1) | $39,399 | $45,336 |
| Interquartile 75% (IQ3) | $55,646 | $58,896 |
| Interquartile Range (IQR) | $16,247 | $13,560 |
| Standard Deviation (Sample) | $14,455 | $12,681 |
| Standard Deviation (Population) | $14,342 | $12,558 |
Similar Demographics by Householder Income Over 65 years
Demographics Similar to Immigrants from Guatemala by Householder Income Over 65 years
In terms of householder income over 65 years, the demographic groups most similar to Immigrants from Guatemala are Immigrants from Liberia ($53,967, a difference of 0.030%), Immigrants from Armenia ($53,974, a difference of 0.040%), Somali ($54,004, a difference of 0.10%), Mexican ($53,897, a difference of 0.10%), and Immigrants from Jamaica ($54,027, a difference of 0.14%).
| Demographics | Rating | Rank | Householder Income Over 65 years |
| Cheyenne | 0.1 /100 | #277 | Tragic $54,096 |
| Immigrants | Ecuador | 0.1 /100 | #278 | Tragic $54,030 |
| Blackfeet | 0.1 /100 | #279 | Tragic $54,029 |
| Immigrants | Jamaica | 0.1 /100 | #280 | Tragic $54,027 |
| Somalis | 0.1 /100 | #281 | Tragic $54,004 |
| Immigrants | Armenia | 0.1 /100 | #282 | Tragic $53,974 |
| Immigrants | Liberia | 0.1 /100 | #283 | Tragic $53,967 |
| Immigrants | Guatemala | 0.1 /100 | #284 | Tragic $53,950 |
| Mexicans | 0.1 /100 | #285 | Tragic $53,897 |
| Chippewa | 0.1 /100 | #286 | Tragic $53,847 |
| Immigrants | Barbados | 0.1 /100 | #287 | Tragic $53,766 |
| Paiute | 0.1 /100 | #288 | Tragic $53,762 |
| Iroquois | 0.1 /100 | #289 | Tragic $53,737 |
| Chickasaw | 0.1 /100 | #290 | Tragic $53,732 |
| Africans | 0.0 /100 | #291 | Tragic $53,711 |
Demographics Similar to Immigrants from Thailand by Householder Income Over 65 years
In terms of householder income over 65 years, the demographic groups most similar to Immigrants from Thailand are Slovene ($60,241, a difference of 0.040%), Albanian ($60,249, a difference of 0.050%), Immigrants from Eritrea ($60,096, a difference of 0.20%), Ghanaian ($60,043, a difference of 0.29%), and Iraqi ($60,466, a difference of 0.41%).
| Demographics | Rating | Rank | Householder Income Over 65 years |
| Immigrants | Morocco | 41.7 /100 | #180 | Average $60,647 |
| Celtics | 40.7 /100 | #181 | Average $60,608 |
| Czechoslovakians | 40.0 /100 | #182 | Average $60,581 |
| Kenyans | 38.4 /100 | #183 | Fair $60,514 |
| Iraqis | 37.2 /100 | #184 | Fair $60,466 |
| Albanians | 32.0 /100 | #185 | Fair $60,249 |
| Slovenes | 31.8 /100 | #186 | Fair $60,241 |
| Immigrants | Thailand | 31.3 /100 | #187 | Fair $60,217 |
| Immigrants | Eritrea | 28.6 /100 | #188 | Fair $60,096 |
| Ghanaians | 27.5 /100 | #189 | Fair $60,043 |
| Puget Sound Salish | 25.3 /100 | #190 | Fair $59,934 |
| Belgians | 24.9 /100 | #191 | Fair $59,915 |
| South Americans | 23.8 /100 | #192 | Fair $59,854 |
| Immigrants | Costa Rica | 23.6 /100 | #193 | Fair $59,848 |
| Immigrants | Africa | 23.4 /100 | #194 | Fair $59,837 |