Marshallese vs Immigrants from North America Householder Income Ages 45 - 64 years
COMPARE
Marshallese
Immigrants from North America
Householder Income Ages 45 - 64 years
Householder Income Ages 45 - 64 years Comparison
Marshallese
Immigrants from North America
$90,455
HOUSEHOLDER INCOME AGES 45 - 64 YEARS
0.7/ 100
METRIC RATING
252nd/ 347
METRIC RANK
$109,198
HOUSEHOLDER INCOME AGES 45 - 64 YEARS
98.8/ 100
METRIC RATING
82nd/ 347
METRIC RANK
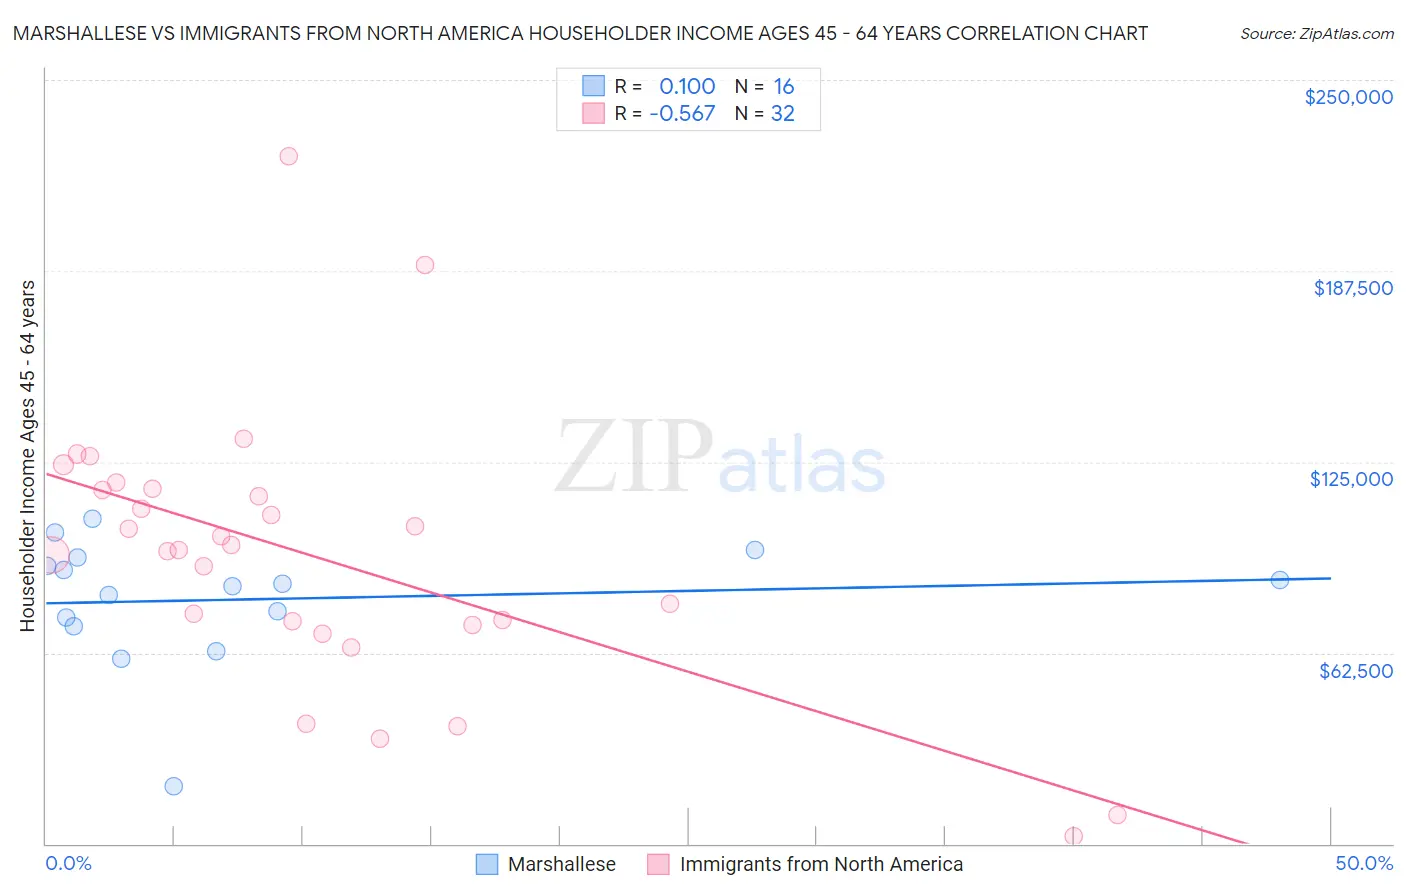
Marshallese vs Immigrants from North America Householder Income Ages 45 - 64 years Correlation Chart
The statistical analysis conducted on geographies consisting of 14,751,694 people shows a slight positive correlation between the proportion of Marshallese and household income with householder between the ages 45 and 64 in the United States with a correlation coefficient (R) of 0.100 and weighted average of $90,455. Similarly, the statistical analysis conducted on geographies consisting of 461,409,956 people shows a substantial negative correlation between the proportion of Immigrants from North America and household income with householder between the ages 45 and 64 in the United States with a correlation coefficient (R) of -0.567 and weighted average of $109,198, a difference of 20.7%.
Householder Income Ages 45 - 64 years Correlation Summary
| Measurement | Marshallese | Immigrants from North America |
| Minimum | $18,640 | $2,499 |
| Maximum | $106,252 | $225,000 |
| Range | $87,612 | $222,501 |
| Mean | $79,964 | $94,322 |
| Median | $84,819 | $96,912 |
| Interquartile 25% (IQ1) | $72,758 | $72,197 |
| Interquartile 75% (IQ3) | $92,231 | $115,910 |
| Interquartile Range (IQR) | $19,473 | $43,714 |
| Standard Deviation (Sample) | $20,771 | $44,789 |
| Standard Deviation (Population) | $20,112 | $44,084 |
Similar Demographics by Householder Income Ages 45 - 64 years
Demographics Similar to Marshallese by Householder Income Ages 45 - 64 years
In terms of householder income ages 45 - 64 years, the demographic groups most similar to Marshallese are American ($90,536, a difference of 0.090%), Barbadian ($90,266, a difference of 0.21%), Subsaharan African ($90,691, a difference of 0.26%), Immigrants from Guyana ($90,186, a difference of 0.30%), and Mexican American Indian ($90,811, a difference of 0.39%).
| Demographics | Rating | Rank | Householder Income Ages 45 - 64 years |
| Guyanese | 0.9 /100 | #245 | Tragic $90,966 |
| Central Americans | 0.9 /100 | #246 | Tragic $90,951 |
| Alaskan Athabascans | 0.9 /100 | #247 | Tragic $90,951 |
| Immigrants | Laos | 0.9 /100 | #248 | Tragic $90,909 |
| Mexican American Indians | 0.8 /100 | #249 | Tragic $90,811 |
| Sub-Saharan Africans | 0.8 /100 | #250 | Tragic $90,691 |
| Americans | 0.7 /100 | #251 | Tragic $90,536 |
| Marshallese | 0.7 /100 | #252 | Tragic $90,455 |
| Barbadians | 0.6 /100 | #253 | Tragic $90,266 |
| Immigrants | Guyana | 0.6 /100 | #254 | Tragic $90,186 |
| West Indians | 0.5 /100 | #255 | Tragic $89,906 |
| French American Indians | 0.5 /100 | #256 | Tragic $89,811 |
| German Russians | 0.4 /100 | #257 | Tragic $89,398 |
| Immigrants | Barbados | 0.4 /100 | #258 | Tragic $89,394 |
| Immigrants | Nicaragua | 0.4 /100 | #259 | Tragic $89,108 |
Demographics Similar to Immigrants from North America by Householder Income Ages 45 - 64 years
In terms of householder income ages 45 - 64 years, the demographic groups most similar to Immigrants from North America are Immigrants from Eastern Europe ($109,335, a difference of 0.12%), Immigrants from Spain ($109,051, a difference of 0.14%), Jordanian ($109,376, a difference of 0.16%), Immigrants from Bulgaria ($109,379, a difference of 0.17%), and Immigrants from Canada ($109,402, a difference of 0.19%).
| Demographics | Rating | Rank | Householder Income Ages 45 - 64 years |
| South Africans | 99.1 /100 | #75 | Exceptional $109,719 |
| Paraguayans | 99.0 /100 | #76 | Exceptional $109,447 |
| Immigrants | England | 99.0 /100 | #77 | Exceptional $109,446 |
| Immigrants | Canada | 99.0 /100 | #78 | Exceptional $109,402 |
| Immigrants | Bulgaria | 98.9 /100 | #79 | Exceptional $109,379 |
| Jordanians | 98.9 /100 | #80 | Exceptional $109,376 |
| Immigrants | Eastern Europe | 98.9 /100 | #81 | Exceptional $109,335 |
| Immigrants | North America | 98.8 /100 | #82 | Exceptional $109,198 |
| Immigrants | Spain | 98.8 /100 | #83 | Exceptional $109,051 |
| Immigrants | Western Europe | 98.6 /100 | #84 | Exceptional $108,824 |
| Immigrants | Afghanistan | 98.6 /100 | #85 | Exceptional $108,785 |
| Austrians | 98.5 /100 | #86 | Exceptional $108,692 |
| Tongans | 98.5 /100 | #87 | Exceptional $108,643 |
| Romanians | 98.5 /100 | #88 | Exceptional $108,609 |
| Ukrainians | 98.3 /100 | #89 | Exceptional $108,475 |