Marshallese vs Immigrants from Morocco Householder Income Ages 45 - 64 years
COMPARE
Marshallese
Immigrants from Morocco
Householder Income Ages 45 - 64 years
Householder Income Ages 45 - 64 years Comparison
Marshallese
Immigrants from Morocco
$90,455
HOUSEHOLDER INCOME AGES 45 - 64 YEARS
0.7/ 100
METRIC RATING
252nd/ 347
METRIC RANK
$102,015
HOUSEHOLDER INCOME AGES 45 - 64 YEARS
70.0/ 100
METRIC RATING
164th/ 347
METRIC RANK
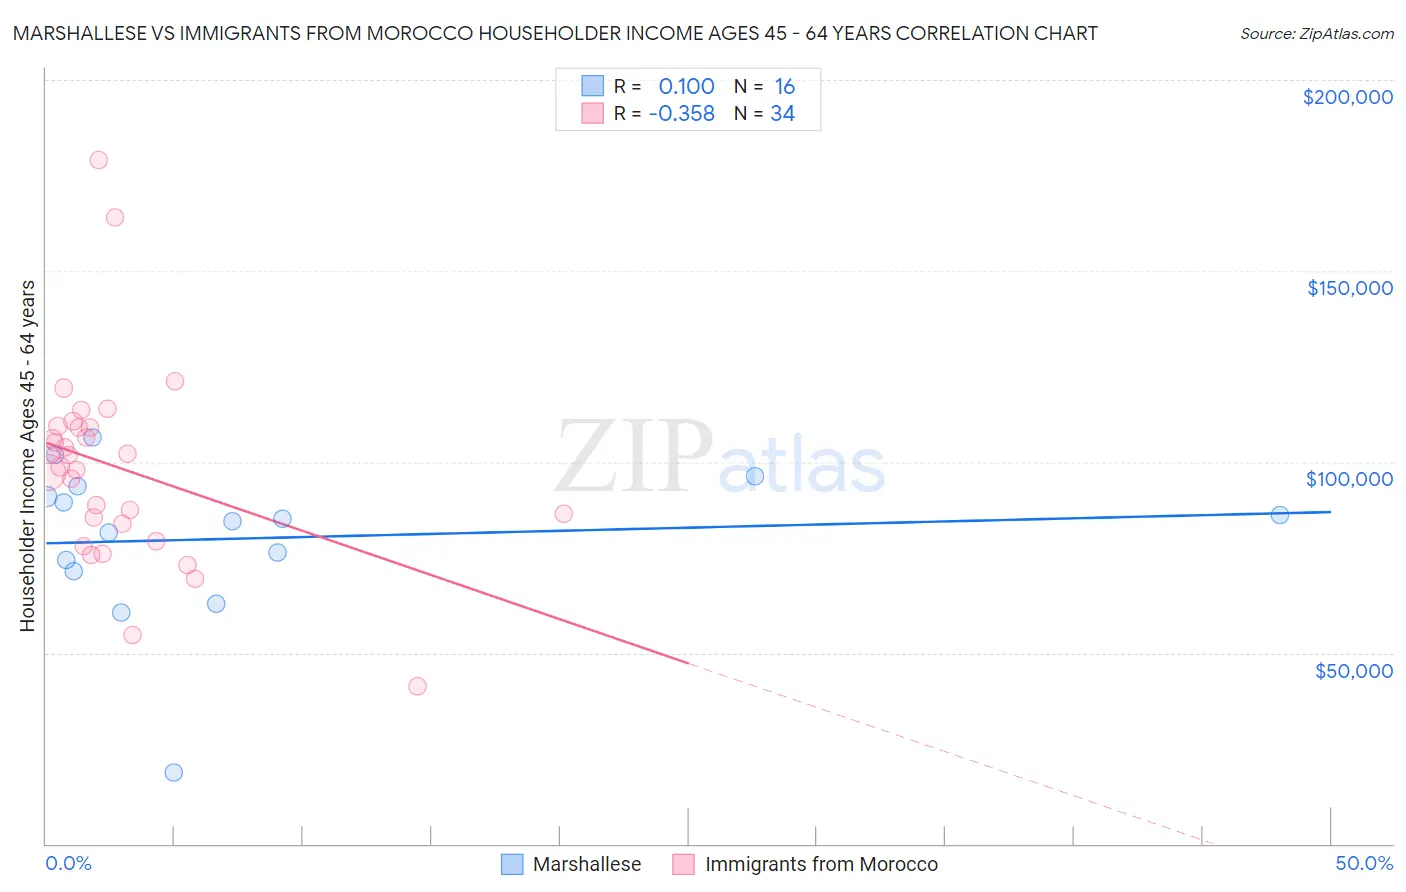
Marshallese vs Immigrants from Morocco Householder Income Ages 45 - 64 years Correlation Chart
The statistical analysis conducted on geographies consisting of 14,751,694 people shows a slight positive correlation between the proportion of Marshallese and household income with householder between the ages 45 and 64 in the United States with a correlation coefficient (R) of 0.100 and weighted average of $90,455. Similarly, the statistical analysis conducted on geographies consisting of 178,864,321 people shows a mild negative correlation between the proportion of Immigrants from Morocco and household income with householder between the ages 45 and 64 in the United States with a correlation coefficient (R) of -0.358 and weighted average of $102,015, a difference of 12.8%.
Householder Income Ages 45 - 64 years Correlation Summary
| Measurement | Marshallese | Immigrants from Morocco |
| Minimum | $18,640 | $41,250 |
| Maximum | $106,252 | $179,202 |
| Range | $87,612 | $137,952 |
| Mean | $79,964 | $98,384 |
| Median | $84,819 | $100,229 |
| Interquartile 25% (IQ1) | $72,758 | $83,916 |
| Interquartile 75% (IQ3) | $92,231 | $109,003 |
| Interquartile Range (IQR) | $19,473 | $25,087 |
| Standard Deviation (Sample) | $20,771 | $25,952 |
| Standard Deviation (Population) | $20,112 | $25,567 |
Similar Demographics by Householder Income Ages 45 - 64 years
Demographics Similar to Marshallese by Householder Income Ages 45 - 64 years
In terms of householder income ages 45 - 64 years, the demographic groups most similar to Marshallese are American ($90,536, a difference of 0.090%), Barbadian ($90,266, a difference of 0.21%), Subsaharan African ($90,691, a difference of 0.26%), Immigrants from Guyana ($90,186, a difference of 0.30%), and Mexican American Indian ($90,811, a difference of 0.39%).
| Demographics | Rating | Rank | Householder Income Ages 45 - 64 years |
| Guyanese | 0.9 /100 | #245 | Tragic $90,966 |
| Central Americans | 0.9 /100 | #246 | Tragic $90,951 |
| Alaskan Athabascans | 0.9 /100 | #247 | Tragic $90,951 |
| Immigrants | Laos | 0.9 /100 | #248 | Tragic $90,909 |
| Mexican American Indians | 0.8 /100 | #249 | Tragic $90,811 |
| Sub-Saharan Africans | 0.8 /100 | #250 | Tragic $90,691 |
| Americans | 0.7 /100 | #251 | Tragic $90,536 |
| Marshallese | 0.7 /100 | #252 | Tragic $90,455 |
| Barbadians | 0.6 /100 | #253 | Tragic $90,266 |
| Immigrants | Guyana | 0.6 /100 | #254 | Tragic $90,186 |
| West Indians | 0.5 /100 | #255 | Tragic $89,906 |
| French American Indians | 0.5 /100 | #256 | Tragic $89,811 |
| German Russians | 0.4 /100 | #257 | Tragic $89,398 |
| Immigrants | Barbados | 0.4 /100 | #258 | Tragic $89,394 |
| Immigrants | Nicaragua | 0.4 /100 | #259 | Tragic $89,108 |
Demographics Similar to Immigrants from Morocco by Householder Income Ages 45 - 64 years
In terms of householder income ages 45 - 64 years, the demographic groups most similar to Immigrants from Morocco are English ($102,021, a difference of 0.010%), Immigrants from Albania ($101,957, a difference of 0.060%), Scottish ($102,123, a difference of 0.11%), Immigrants from Nepal ($102,190, a difference of 0.17%), and Icelander ($102,261, a difference of 0.24%).
| Demographics | Rating | Rank | Householder Income Ages 45 - 64 years |
| Immigrants | Ethiopia | 77.3 /100 | #157 | Good $102,763 |
| Slavs | 76.1 /100 | #158 | Good $102,629 |
| Sierra Leoneans | 74.2 /100 | #159 | Good $102,427 |
| Icelanders | 72.5 /100 | #160 | Good $102,261 |
| Immigrants | Nepal | 71.8 /100 | #161 | Good $102,190 |
| Scottish | 71.1 /100 | #162 | Good $102,123 |
| English | 70.1 /100 | #163 | Good $102,021 |
| Immigrants | Morocco | 70.0 /100 | #164 | Good $102,015 |
| Immigrants | Albania | 69.4 /100 | #165 | Good $101,957 |
| Samoans | 65.3 /100 | #166 | Good $101,580 |
| Czechoslovakians | 63.0 /100 | #167 | Good $101,387 |
| South American Indians | 60.5 /100 | #168 | Good $101,171 |
| Guamanians/Chamorros | 60.5 /100 | #169 | Good $101,170 |
| Slovaks | 58.8 /100 | #170 | Average $101,029 |
| South Americans | 56.4 /100 | #171 | Average $100,837 |