Maltese vs Immigrants from Northern Europe Householder Income Ages 25 - 44 years
COMPARE
Maltese
Immigrants from Northern Europe
Householder Income Ages 25 - 44 years
Householder Income Ages 25 - 44 years Comparison
Maltese
Immigrants from Northern Europe
$110,064
HOUSEHOLDER INCOME AGES 25 - 44 YEARS
100.0/ 100
METRIC RATING
31st/ 347
METRIC RANK
$111,676
HOUSEHOLDER INCOME AGES 25 - 44 YEARS
100.0/ 100
METRIC RATING
25th/ 347
METRIC RANK
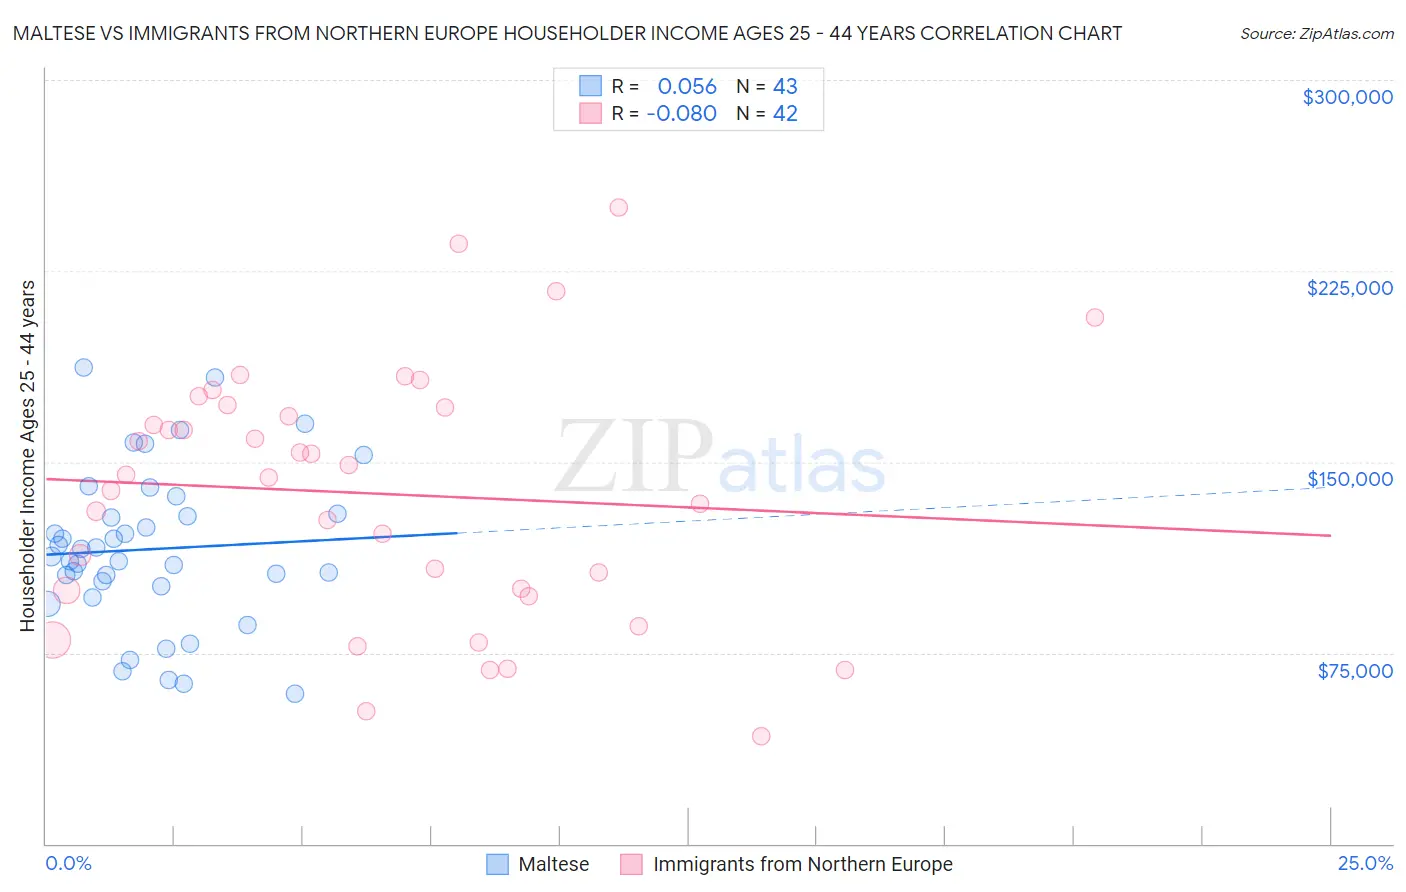
Maltese vs Immigrants from Northern Europe Householder Income Ages 25 - 44 years Correlation Chart
The statistical analysis conducted on geographies consisting of 126,133,875 people shows a slight positive correlation between the proportion of Maltese and household income with householder between the ages 25 and 44 in the United States with a correlation coefficient (R) of 0.056 and weighted average of $110,064. Similarly, the statistical analysis conducted on geographies consisting of 475,162,108 people shows a slight negative correlation between the proportion of Immigrants from Northern Europe and household income with householder between the ages 25 and 44 in the United States with a correlation coefficient (R) of -0.080 and weighted average of $111,676, a difference of 1.5%.
Householder Income Ages 25 - 44 years Correlation Summary
| Measurement | Maltese | Immigrants from Northern Europe |
| Minimum | $58,867 | $42,036 |
| Maximum | $186,969 | $250,001 |
| Range | $128,102 | $207,965 |
| Mean | $115,666 | $137,540 |
| Median | $112,847 | $144,261 |
| Interquartile 25% (IQ1) | $101,168 | $99,498 |
| Interquartile 75% (IQ3) | $129,763 | $171,539 |
| Interquartile Range (IQR) | $28,595 | $72,041 |
| Standard Deviation (Sample) | $30,812 | $49,597 |
| Standard Deviation (Population) | $30,451 | $49,003 |
Demographics Similar to Maltese and Immigrants from Northern Europe by Householder Income Ages 25 - 44 years
In terms of householder income ages 25 - 44 years, the demographic groups most similar to Maltese are Immigrants from Greece ($110,103, a difference of 0.040%), Turkish ($110,318, a difference of 0.23%), Immigrants from Denmark ($110,363, a difference of 0.27%), Immigrants from Sri Lanka ($109,741, a difference of 0.29%), and Russian ($110,398, a difference of 0.30%). Similarly, the demographic groups most similar to Immigrants from Northern Europe are Immigrants from Sweden ($112,010, a difference of 0.30%), Immigrants from Japan ($112,228, a difference of 0.49%), Immigrants from Belgium ($112,575, a difference of 0.80%), Immigrants from Asia ($110,787, a difference of 0.80%), and Asian ($112,666, a difference of 0.89%).
| Demographics | Rating | Rank | Householder Income Ages 25 - 44 years |
| Eastern Europeans | 100.0 /100 | #18 | Exceptional $114,523 |
| Burmese | 100.0 /100 | #19 | Exceptional $113,701 |
| Immigrants | Korea | 100.0 /100 | #20 | Exceptional $113,401 |
| Asians | 100.0 /100 | #21 | Exceptional $112,666 |
| Immigrants | Belgium | 100.0 /100 | #22 | Exceptional $112,575 |
| Immigrants | Japan | 100.0 /100 | #23 | Exceptional $112,228 |
| Immigrants | Sweden | 100.0 /100 | #24 | Exceptional $112,010 |
| Immigrants | Northern Europe | 100.0 /100 | #25 | Exceptional $111,676 |
| Immigrants | Asia | 100.0 /100 | #26 | Exceptional $110,787 |
| Russians | 100.0 /100 | #27 | Exceptional $110,398 |
| Immigrants | Denmark | 100.0 /100 | #28 | Exceptional $110,363 |
| Turks | 100.0 /100 | #29 | Exceptional $110,318 |
| Immigrants | Greece | 100.0 /100 | #30 | Exceptional $110,103 |
| Maltese | 100.0 /100 | #31 | Exceptional $110,064 |
| Immigrants | Sri Lanka | 100.0 /100 | #32 | Exceptional $109,741 |
| Bhutanese | 100.0 /100 | #33 | Exceptional $109,520 |
| Bolivians | 100.0 /100 | #34 | Exceptional $109,372 |
| Immigrants | Switzerland | 100.0 /100 | #35 | Exceptional $109,185 |
| Latvians | 100.0 /100 | #36 | Exceptional $108,926 |
| Immigrants | Russia | 100.0 /100 | #37 | Exceptional $108,751 |
| Soviet Union | 100.0 /100 | #38 | Exceptional $108,457 |