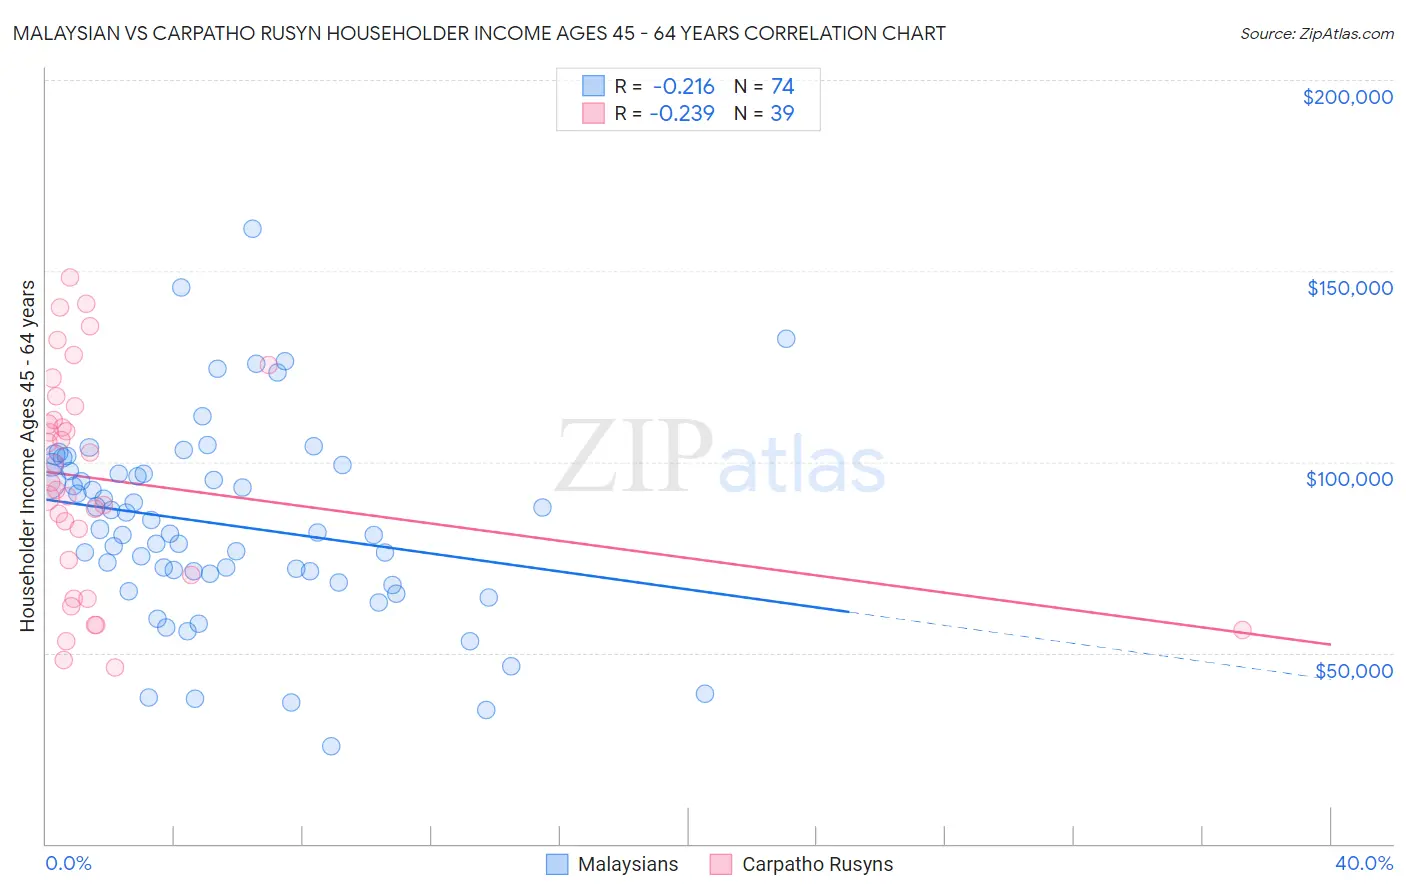
Malaysian vs Carpatho Rusyn Householder Income Ages 45 - 64 years
COMPARE
Malaysian
Carpatho Rusyn
Householder Income Ages 45 - 64 years
Householder Income Ages 45 - 64 years Comparison
Malaysians
Carpatho Rusyns
$94,517
HOUSEHOLDER INCOME AGES 45 - 64 YEARS
5.2/ 100
METRIC RATING
222nd/ 347
METRIC RANK
$102,777
HOUSEHOLDER INCOME AGES 45 - 64 YEARS
77.4/ 100
METRIC RATING
156th/ 347
METRIC RANK
Malaysian vs Carpatho Rusyn Householder Income Ages 45 - 64 years Correlation Chart
The statistical analysis conducted on geographies consisting of 225,853,925 people shows a weak negative correlation between the proportion of Malaysians and household income with householder between the ages 45 and 64 in the United States with a correlation coefficient (R) of -0.216 and weighted average of $94,517. Similarly, the statistical analysis conducted on geographies consisting of 58,863,567 people shows a weak negative correlation between the proportion of Carpatho Rusyns and household income with householder between the ages 45 and 64 in the United States with a correlation coefficient (R) of -0.239 and weighted average of $102,777, a difference of 8.7%.
Householder Income Ages 45 - 64 years Correlation Summary
| Measurement | Malaysian | Carpatho Rusyn |
| Minimum | $25,536 | $46,000 |
| Maximum | $161,017 | $148,438 |
| Range | $135,481 | $102,438 |
| Mean | $83,626 | $95,246 |
| Median | $81,950 | $94,602 |
| Interquartile 25% (IQ1) | $70,625 | $70,250 |
| Interquartile 75% (IQ3) | $97,581 | $114,408 |
| Interquartile Range (IQR) | $26,956 | $44,158 |
| Standard Deviation (Sample) | $25,472 | $28,203 |
| Standard Deviation (Population) | $25,299 | $27,839 |
Similar Demographics by Householder Income Ages 45 - 64 years
Demographics Similar to Malaysians by Householder Income Ages 45 - 64 years
In terms of householder income ages 45 - 64 years, the demographic groups most similar to Malaysians are Nonimmigrants ($94,448, a difference of 0.070%), Immigrants from Bosnia and Herzegovina ($94,288, a difference of 0.24%), Immigrants from Nigeria ($94,804, a difference of 0.30%), Salvadoran ($94,842, a difference of 0.34%), and Bermudan ($94,197, a difference of 0.34%).
| Demographics | Rating | Rank | Householder Income Ages 45 - 64 years |
| Nigerians | 8.2 /100 | #215 | Tragic $95,492 |
| Immigrants | Venezuela | 7.6 /100 | #216 | Tragic $95,342 |
| Immigrants | Ghana | 6.4 /100 | #217 | Tragic $94,982 |
| Delaware | 6.2 /100 | #218 | Tragic $94,914 |
| Immigrants | Armenia | 6.1 /100 | #219 | Tragic $94,863 |
| Salvadorans | 6.0 /100 | #220 | Tragic $94,842 |
| Immigrants | Nigeria | 5.9 /100 | #221 | Tragic $94,804 |
| Malaysians | 5.2 /100 | #222 | Tragic $94,517 |
| Immigrants | Nonimmigrants | 5.0 /100 | #223 | Tragic $94,448 |
| Immigrants | Bosnia and Herzegovina | 4.6 /100 | #224 | Tragic $94,288 |
| Bermudans | 4.4 /100 | #225 | Tragic $94,197 |
| Immigrants | Azores | 4.3 /100 | #226 | Tragic $94,138 |
| Alaska Natives | 4.0 /100 | #227 | Tragic $93,991 |
| Immigrants | Panama | 3.7 /100 | #228 | Tragic $93,815 |
| Vietnamese | 3.6 /100 | #229 | Tragic $93,788 |
Demographics Similar to Carpatho Rusyns by Householder Income Ages 45 - 64 years
In terms of householder income ages 45 - 64 years, the demographic groups most similar to Carpatho Rusyns are Costa Rican ($102,779, a difference of 0.0%), Immigrants from Ethiopia ($102,763, a difference of 0.010%), Slovene ($102,885, a difference of 0.11%), Slavic ($102,629, a difference of 0.14%), and Scandinavian ($102,969, a difference of 0.19%).
| Demographics | Rating | Rank | Householder Income Ages 45 - 64 years |
| Immigrants | Sierra Leone | 81.1 /100 | #149 | Excellent $103,227 |
| Immigrants | Peru | 80.7 /100 | #150 | Excellent $103,173 |
| Swiss | 79.9 /100 | #151 | Good $103,071 |
| Irish | 79.8 /100 | #152 | Good $103,067 |
| Scandinavians | 79.0 /100 | #153 | Good $102,969 |
| Slovenes | 78.3 /100 | #154 | Good $102,885 |
| Costa Ricans | 77.4 /100 | #155 | Good $102,779 |
| Carpatho Rusyns | 77.4 /100 | #156 | Good $102,777 |
| Immigrants | Ethiopia | 77.3 /100 | #157 | Good $102,763 |
| Slavs | 76.1 /100 | #158 | Good $102,629 |
| Sierra Leoneans | 74.2 /100 | #159 | Good $102,427 |
| Icelanders | 72.5 /100 | #160 | Good $102,261 |
| Immigrants | Nepal | 71.8 /100 | #161 | Good $102,190 |
| Scottish | 71.1 /100 | #162 | Good $102,123 |
| English | 70.1 /100 | #163 | Good $102,021 |