Immigrants from Costa Rica vs Carpatho Rusyn Householder Income Ages 45 - 64 years
COMPARE
Immigrants from Costa Rica
Carpatho Rusyn
Householder Income Ages 45 - 64 years
Householder Income Ages 45 - 64 years Comparison
Immigrants from Costa Rica
Carpatho Rusyns
$100,141
HOUSEHOLDER INCOME AGES 45 - 64 YEARS
47.7/ 100
METRIC RATING
176th/ 347
METRIC RANK
$102,777
HOUSEHOLDER INCOME AGES 45 - 64 YEARS
77.4/ 100
METRIC RATING
156th/ 347
METRIC RANK
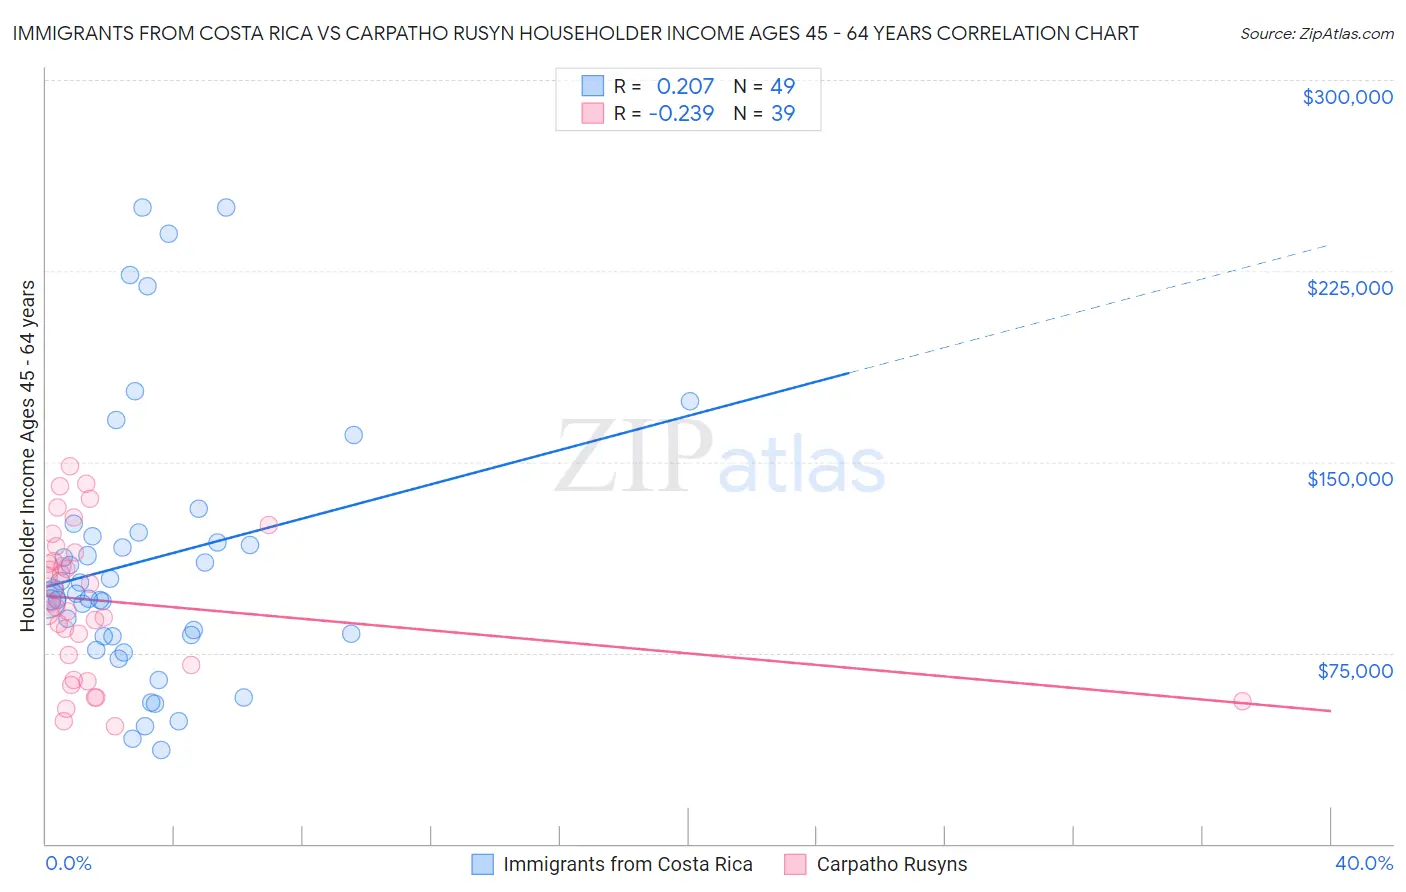
Immigrants from Costa Rica vs Carpatho Rusyn Householder Income Ages 45 - 64 years Correlation Chart
The statistical analysis conducted on geographies consisting of 204,163,177 people shows a weak positive correlation between the proportion of Immigrants from Costa Rica and household income with householder between the ages 45 and 64 in the United States with a correlation coefficient (R) of 0.207 and weighted average of $100,141. Similarly, the statistical analysis conducted on geographies consisting of 58,863,567 people shows a weak negative correlation between the proportion of Carpatho Rusyns and household income with householder between the ages 45 and 64 in the United States with a correlation coefficient (R) of -0.239 and weighted average of $102,777, a difference of 2.6%.
Householder Income Ages 45 - 64 years Correlation Summary
| Measurement | Immigrants from Costa Rica | Carpatho Rusyn |
| Minimum | $36,667 | $46,000 |
| Maximum | $250,001 | $148,438 |
| Range | $213,334 | $102,438 |
| Mean | $111,542 | $95,246 |
| Median | $98,012 | $94,602 |
| Interquartile 25% (IQ1) | $81,355 | $70,250 |
| Interquartile 75% (IQ3) | $121,642 | $114,408 |
| Interquartile Range (IQR) | $40,287 | $44,158 |
| Standard Deviation (Sample) | $53,037 | $28,203 |
| Standard Deviation (Population) | $52,493 | $27,839 |
Demographics Similar to Immigrants from Costa Rica and Carpatho Rusyns by Householder Income Ages 45 - 64 years
In terms of householder income ages 45 - 64 years, the demographic groups most similar to Immigrants from Costa Rica are German ($100,224, a difference of 0.080%), Welsh ($100,322, a difference of 0.18%), Alsatian ($100,435, a difference of 0.29%), Immigrants from Uzbekistan ($100,523, a difference of 0.38%), and South American ($100,837, a difference of 0.69%). Similarly, the demographic groups most similar to Carpatho Rusyns are Immigrants from Ethiopia ($102,763, a difference of 0.010%), Slavic ($102,629, a difference of 0.14%), Sierra Leonean ($102,427, a difference of 0.34%), Icelander ($102,261, a difference of 0.50%), and Immigrants from Nepal ($102,190, a difference of 0.57%).
| Demographics | Rating | Rank | Householder Income Ages 45 - 64 years |
| Carpatho Rusyns | 77.4 /100 | #156 | Good $102,777 |
| Immigrants | Ethiopia | 77.3 /100 | #157 | Good $102,763 |
| Slavs | 76.1 /100 | #158 | Good $102,629 |
| Sierra Leoneans | 74.2 /100 | #159 | Good $102,427 |
| Icelanders | 72.5 /100 | #160 | Good $102,261 |
| Immigrants | Nepal | 71.8 /100 | #161 | Good $102,190 |
| Scottish | 71.1 /100 | #162 | Good $102,123 |
| English | 70.1 /100 | #163 | Good $102,021 |
| Immigrants | Morocco | 70.0 /100 | #164 | Good $102,015 |
| Immigrants | Albania | 69.4 /100 | #165 | Good $101,957 |
| Samoans | 65.3 /100 | #166 | Good $101,580 |
| Czechoslovakians | 63.0 /100 | #167 | Good $101,387 |
| South American Indians | 60.5 /100 | #168 | Good $101,171 |
| Guamanians/Chamorros | 60.5 /100 | #169 | Good $101,170 |
| Slovaks | 58.8 /100 | #170 | Average $101,029 |
| South Americans | 56.4 /100 | #171 | Average $100,837 |
| Immigrants | Uzbekistan | 52.5 /100 | #172 | Average $100,523 |
| Alsatians | 51.4 /100 | #173 | Average $100,435 |
| Welsh | 50.0 /100 | #174 | Average $100,322 |
| Germans | 48.8 /100 | #175 | Average $100,224 |
| Immigrants | Costa Rica | 47.7 /100 | #176 | Average $100,141 |