Luxembourger vs English Householder Income Under 25 years
COMPARE
Luxembourger
English
Householder Income Under 25 years
Householder Income Under 25 years Comparison
Luxembourgers
English
$50,379
HOUSEHOLDER INCOME UNDER 25 YEARS
1.2/ 100
METRIC RATING
254th/ 347
METRIC RANK
$50,805
HOUSEHOLDER INCOME UNDER 25 YEARS
3.3/ 100
METRIC RATING
236th/ 347
METRIC RANK
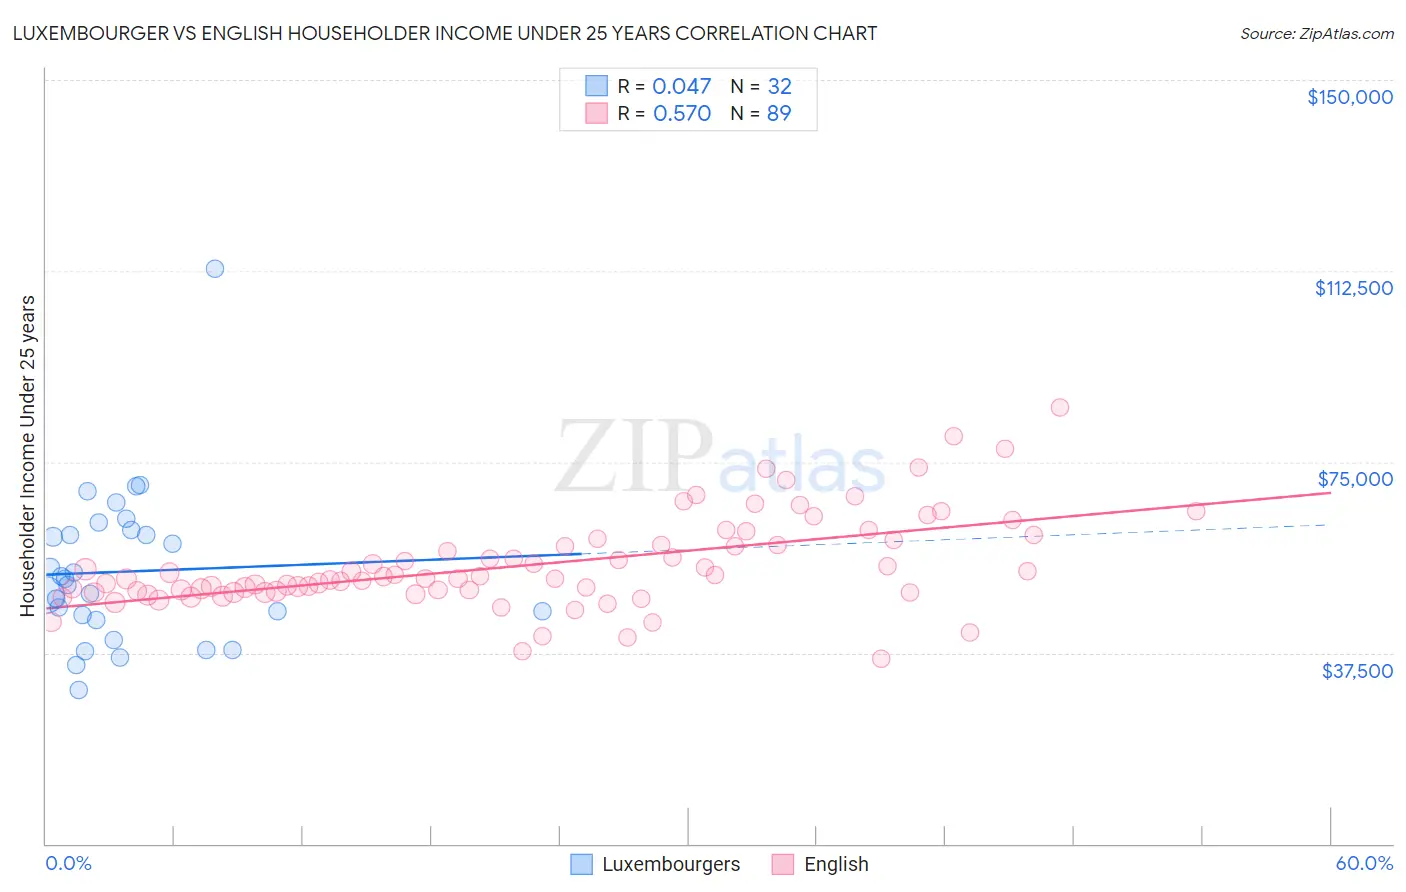
Luxembourger vs English Householder Income Under 25 years Correlation Chart
The statistical analysis conducted on geographies consisting of 133,229,514 people shows no correlation between the proportion of Luxembourgers and household income with householder under the age of 25 in the United States with a correlation coefficient (R) of 0.047 and weighted average of $50,379. Similarly, the statistical analysis conducted on geographies consisting of 440,590,191 people shows a substantial positive correlation between the proportion of English and household income with householder under the age of 25 in the United States with a correlation coefficient (R) of 0.570 and weighted average of $50,805, a difference of 0.84%.
Householder Income Under 25 years Correlation Summary
| Measurement | Luxembourger | English |
| Minimum | $30,181 | $36,250 |
| Maximum | $112,908 | $85,625 |
| Range | $82,726 | $49,375 |
| Mean | $53,440 | $54,811 |
| Median | $51,427 | $52,083 |
| Interquartile 25% (IQ1) | $44,462 | $49,480 |
| Interquartile 75% (IQ3) | $61,145 | $59,272 |
| Interquartile Range (IQR) | $16,682 | $9,791 |
| Standard Deviation (Sample) | $15,505 | $9,060 |
| Standard Deviation (Population) | $15,261 | $9,009 |
Demographics Similar to Luxembourgers and English by Householder Income Under 25 years
In terms of householder income under 25 years, the demographic groups most similar to Luxembourgers are Aleut ($50,377, a difference of 0.010%), Immigrants from Haiti ($50,398, a difference of 0.040%), Immigrants from Mexico ($50,422, a difference of 0.080%), Celtic ($50,447, a difference of 0.13%), and Immigrants from Cabo Verde ($50,520, a difference of 0.28%). Similarly, the demographic groups most similar to English are German ($50,804, a difference of 0.0%), Iraqi ($50,802, a difference of 0.010%), Spanish ($50,813, a difference of 0.020%), Immigrants from Caribbean ($50,757, a difference of 0.090%), and Immigrants from Lebanon ($50,729, a difference of 0.15%).
| Demographics | Rating | Rank | Householder Income Under 25 years |
| Spanish | 3.3 /100 | #235 | Tragic $50,813 |
| English | 3.3 /100 | #236 | Tragic $50,805 |
| Germans | 3.3 /100 | #237 | Tragic $50,804 |
| Iraqis | 3.2 /100 | #238 | Tragic $50,802 |
| Immigrants | Caribbean | 2.9 /100 | #239 | Tragic $50,757 |
| Immigrants | Lebanon | 2.7 /100 | #240 | Tragic $50,729 |
| Immigrants | Micronesia | 2.5 /100 | #241 | Tragic $50,691 |
| Cubans | 2.3 /100 | #242 | Tragic $50,655 |
| Immigrants | Thailand | 2.2 /100 | #243 | Tragic $50,645 |
| Marshallese | 2.1 /100 | #244 | Tragic $50,627 |
| Immigrants | Africa | 2.0 /100 | #245 | Tragic $50,609 |
| Welsh | 2.0 /100 | #246 | Tragic $50,597 |
| Immigrants | Bosnia and Herzegovina | 1.8 /100 | #247 | Tragic $50,565 |
| Slavs | 1.8 /100 | #248 | Tragic $50,563 |
| Scottish | 1.8 /100 | #249 | Tragic $50,554 |
| Immigrants | Cabo Verde | 1.7 /100 | #250 | Tragic $50,520 |
| Celtics | 1.4 /100 | #251 | Tragic $50,447 |
| Immigrants | Mexico | 1.3 /100 | #252 | Tragic $50,422 |
| Immigrants | Haiti | 1.2 /100 | #253 | Tragic $50,398 |
| Luxembourgers | 1.2 /100 | #254 | Tragic $50,379 |
| Aleuts | 1.2 /100 | #255 | Tragic $50,377 |