Lumbee vs Immigrants from Lebanon Householder Income Ages 45 - 64 years
COMPARE
Lumbee
Immigrants from Lebanon
Householder Income Ages 45 - 64 years
Householder Income Ages 45 - 64 years Comparison
Lumbee
Immigrants from Lebanon
$65,113
HOUSEHOLDER INCOME AGES 45 - 64 YEARS
0.0/ 100
METRIC RATING
347th/ 347
METRIC RANK
$108,471
HOUSEHOLDER INCOME AGES 45 - 64 YEARS
98.3/ 100
METRIC RATING
91st/ 347
METRIC RANK
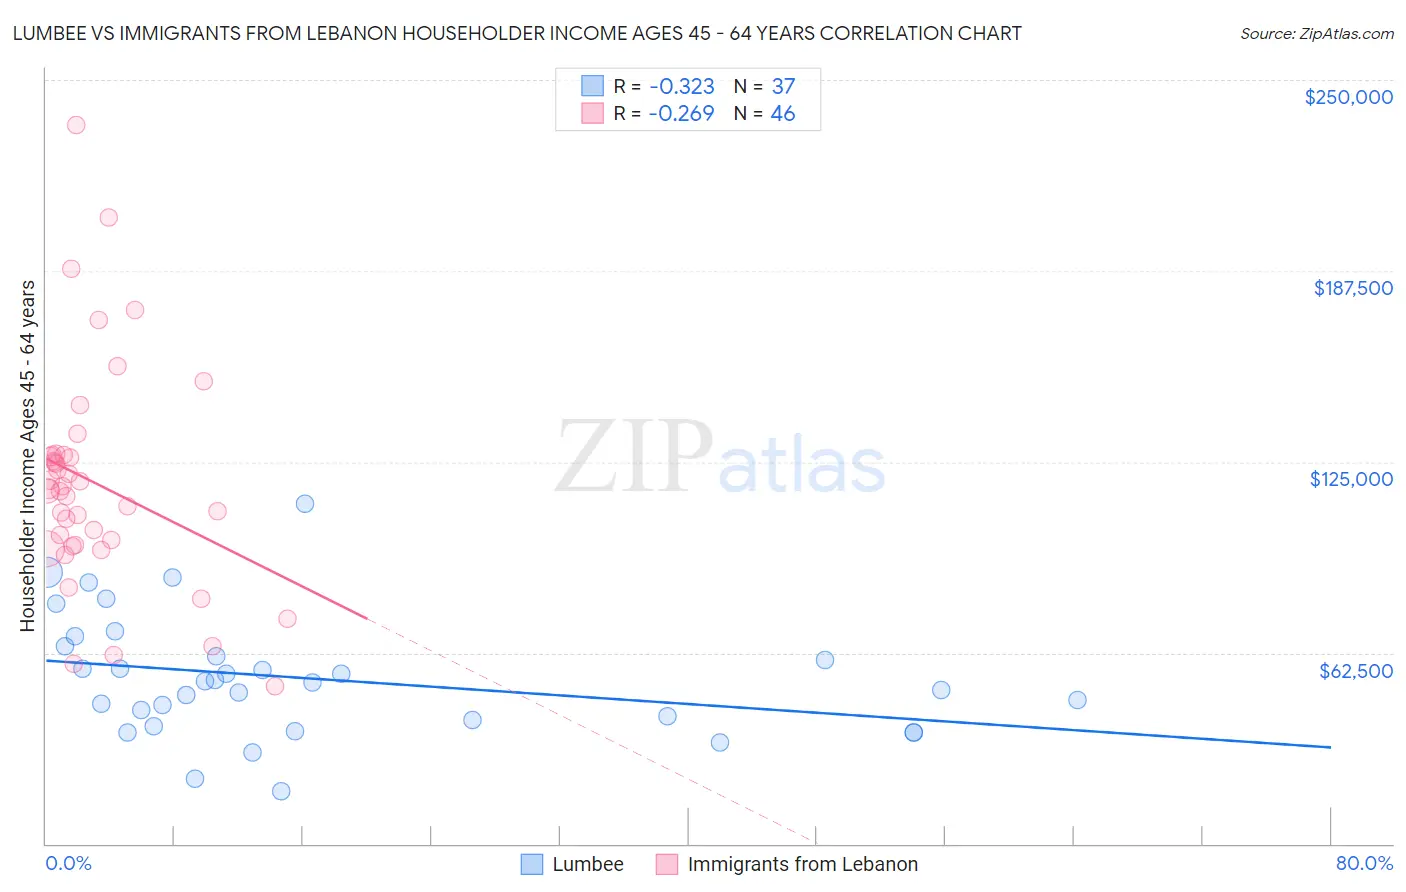
Lumbee vs Immigrants from Lebanon Householder Income Ages 45 - 64 years Correlation Chart
The statistical analysis conducted on geographies consisting of 92,190,651 people shows a mild negative correlation between the proportion of Lumbee and household income with householder between the ages 45 and 64 in the United States with a correlation coefficient (R) of -0.323 and weighted average of $65,113. Similarly, the statistical analysis conducted on geographies consisting of 217,063,471 people shows a weak negative correlation between the proportion of Immigrants from Lebanon and household income with householder between the ages 45 and 64 in the United States with a correlation coefficient (R) of -0.269 and weighted average of $108,471, a difference of 66.6%.
Householder Income Ages 45 - 64 years Correlation Summary
| Measurement | Lumbee | Immigrants from Lebanon |
| Minimum | $17,237 | $51,559 |
| Maximum | $111,146 | $235,112 |
| Range | $93,909 | $183,553 |
| Mean | $53,963 | $118,072 |
| Median | $52,786 | $115,795 |
| Interquartile 25% (IQ1) | $39,477 | $97,661 |
| Interquartile 75% (IQ3) | $62,870 | $127,190 |
| Interquartile Range (IQR) | $23,393 | $29,528 |
| Standard Deviation (Sample) | $19,805 | $36,074 |
| Standard Deviation (Population) | $19,536 | $35,680 |
Similar Demographics by Householder Income Ages 45 - 64 years
Demographics Similar to Lumbee by Householder Income Ages 45 - 64 years
In terms of householder income ages 45 - 64 years, the demographic groups most similar to Lumbee are Puerto Rican ($69,234, a difference of 6.3%), Navajo ($69,759, a difference of 7.1%), Houma ($72,093, a difference of 10.7%), Pima ($73,365, a difference of 12.7%), and Tohono O'odham ($73,774, a difference of 13.3%).
| Demographics | Rating | Rank | Householder Income Ages 45 - 64 years |
| Immigrants | Congo | 0.0 /100 | #333 | Tragic $77,850 |
| Menominee | 0.0 /100 | #334 | Tragic $76,903 |
| Cheyenne | 0.0 /100 | #335 | Tragic $76,362 |
| Arapaho | 0.0 /100 | #336 | Tragic $75,945 |
| Pueblo | 0.0 /100 | #337 | Tragic $75,601 |
| Hopi | 0.0 /100 | #338 | Tragic $75,562 |
| Kiowa | 0.0 /100 | #339 | Tragic $74,815 |
| Immigrants | Yemen | 0.0 /100 | #340 | Tragic $74,575 |
| Crow | 0.0 /100 | #341 | Tragic $74,257 |
| Tohono O'odham | 0.0 /100 | #342 | Tragic $73,774 |
| Pima | 0.0 /100 | #343 | Tragic $73,365 |
| Houma | 0.0 /100 | #344 | Tragic $72,093 |
| Navajo | 0.0 /100 | #345 | Tragic $69,759 |
| Puerto Ricans | 0.0 /100 | #346 | Tragic $69,234 |
| Lumbee | 0.0 /100 | #347 | Tragic $65,113 |
Demographics Similar to Immigrants from Lebanon by Householder Income Ages 45 - 64 years
In terms of householder income ages 45 - 64 years, the demographic groups most similar to Immigrants from Lebanon are Ukrainian ($108,475, a difference of 0.0%), Immigrants from Philippines ($108,471, a difference of 0.0%), Croatian ($108,383, a difference of 0.080%), Romanian ($108,609, a difference of 0.13%), and Immigrants from Croatia ($108,304, a difference of 0.15%).
| Demographics | Rating | Rank | Householder Income Ages 45 - 64 years |
| Immigrants | Western Europe | 98.6 /100 | #84 | Exceptional $108,824 |
| Immigrants | Afghanistan | 98.6 /100 | #85 | Exceptional $108,785 |
| Austrians | 98.5 /100 | #86 | Exceptional $108,692 |
| Tongans | 98.5 /100 | #87 | Exceptional $108,643 |
| Romanians | 98.5 /100 | #88 | Exceptional $108,609 |
| Ukrainians | 98.3 /100 | #89 | Exceptional $108,475 |
| Immigrants | Philippines | 98.3 /100 | #90 | Exceptional $108,471 |
| Immigrants | Lebanon | 98.3 /100 | #91 | Exceptional $108,471 |
| Croatians | 98.3 /100 | #92 | Exceptional $108,383 |
| Immigrants | Croatia | 98.2 /100 | #93 | Exceptional $108,304 |
| Sri Lankans | 98.2 /100 | #94 | Exceptional $108,270 |
| Immigrants | Hungary | 98.2 /100 | #95 | Exceptional $108,267 |
| Immigrants | Argentina | 98.2 /100 | #96 | Exceptional $108,264 |
| Northern Europeans | 97.8 /100 | #97 | Exceptional $107,870 |
| Immigrants | Southern Europe | 97.7 /100 | #98 | Exceptional $107,775 |