Lumbee vs Blackfeet Median Family Income
COMPARE
Lumbee
Blackfeet
Median Family Income
Median Family Income Comparison
Lumbee
Blackfeet
$68,679
MEDIAN FAMILY INCOME
0.0/ 100
METRIC RATING
347th/ 347
METRIC RANK
$88,717
MEDIAN FAMILY INCOME
0.1/ 100
METRIC RATING
281st/ 347
METRIC RANK
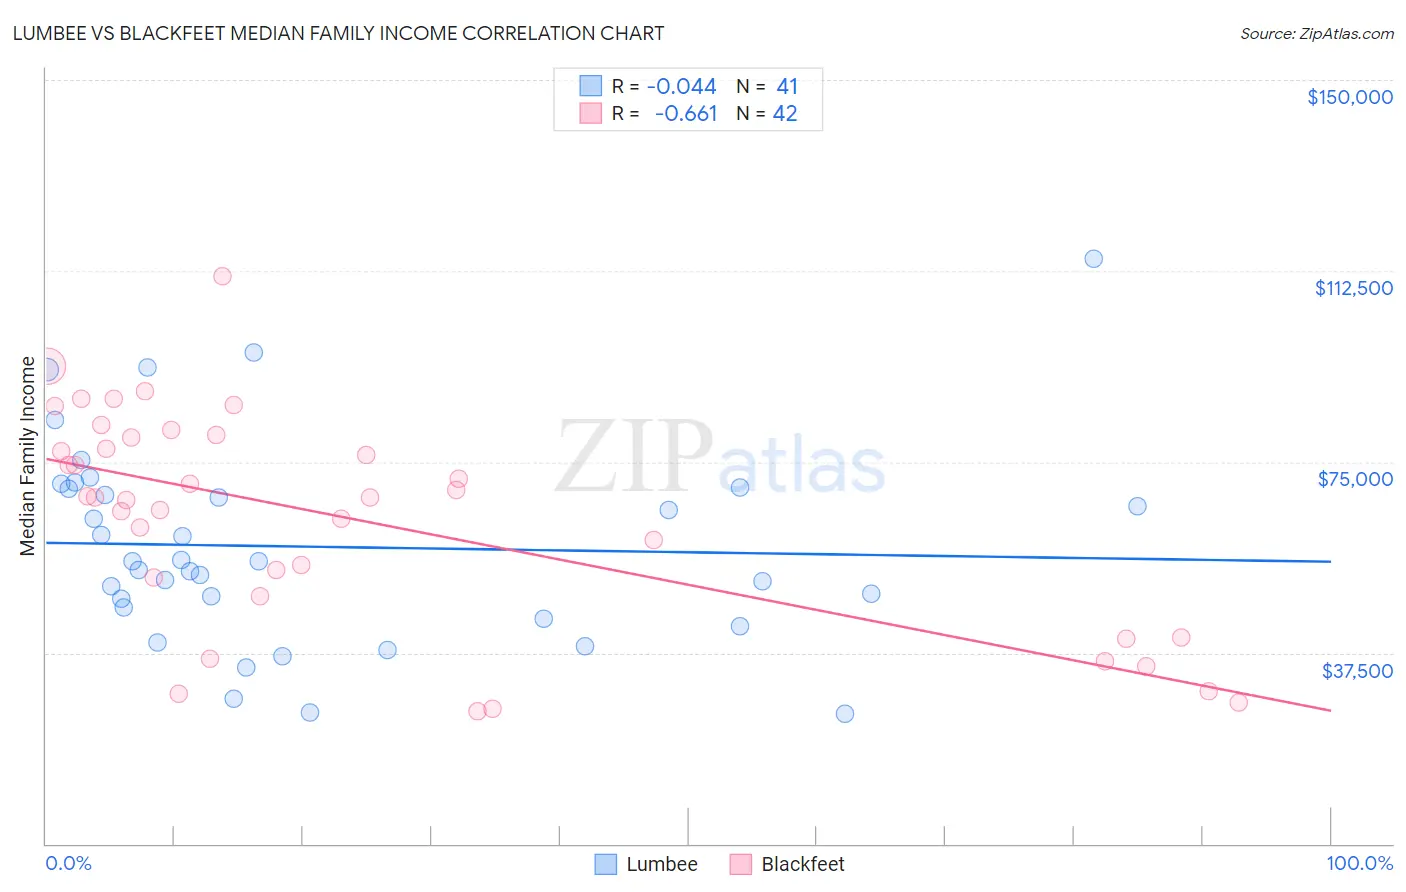
Lumbee vs Blackfeet Median Family Income Correlation Chart
The statistical analysis conducted on geographies consisting of 92,247,043 people shows no correlation between the proportion of Lumbee and median family income in the United States with a correlation coefficient (R) of -0.044 and weighted average of $68,679. Similarly, the statistical analysis conducted on geographies consisting of 309,409,082 people shows a significant negative correlation between the proportion of Blackfeet and median family income in the United States with a correlation coefficient (R) of -0.661 and weighted average of $88,717, a difference of 29.2%.
Median Family Income Correlation Summary
| Measurement | Lumbee | Blackfeet |
| Minimum | $25,481 | $26,000 |
| Maximum | $114,792 | $111,536 |
| Range | $89,311 | $85,536 |
| Mean | $58,324 | $63,847 |
| Median | $55,406 | $68,073 |
| Interquartile 25% (IQ1) | $45,288 | $48,694 |
| Interquartile 75% (IQ3) | $69,902 | $79,668 |
| Interquartile Range (IQR) | $24,614 | $30,974 |
| Standard Deviation (Sample) | $19,662 | $21,241 |
| Standard Deviation (Population) | $19,420 | $20,987 |
Similar Demographics by Median Family Income
Demographics Similar to Lumbee by Median Family Income
In terms of median family income, the demographic groups most similar to Lumbee are Puerto Rican ($70,423, a difference of 2.5%), Navajo ($70,989, a difference of 3.4%), Tohono O'odham ($72,193, a difference of 5.1%), Houma ($76,188, a difference of 10.9%), and Crow ($76,605, a difference of 11.5%).
| Demographics | Rating | Rank | Median Family Income |
| Kiowa | 0.0 /100 | #333 | Tragic $80,885 |
| Menominee | 0.0 /100 | #334 | Tragic $79,563 |
| Yup'ik | 0.0 /100 | #335 | Tragic $79,290 |
| Immigrants | Cuba | 0.0 /100 | #336 | Tragic $78,249 |
| Yuman | 0.0 /100 | #337 | Tragic $78,055 |
| Immigrants | Yemen | 0.0 /100 | #338 | Tragic $77,457 |
| Pima | 0.0 /100 | #339 | Tragic $77,431 |
| Hopi | 0.0 /100 | #340 | Tragic $77,188 |
| Pueblo | 0.0 /100 | #341 | Tragic $76,880 |
| Crow | 0.0 /100 | #342 | Tragic $76,605 |
| Houma | 0.0 /100 | #343 | Tragic $76,188 |
| Tohono O'odham | 0.0 /100 | #344 | Tragic $72,193 |
| Navajo | 0.0 /100 | #345 | Tragic $70,989 |
| Puerto Ricans | 0.0 /100 | #346 | Tragic $70,423 |
| Lumbee | 0.0 /100 | #347 | Tragic $68,679 |
Demographics Similar to Blackfeet by Median Family Income
In terms of median family income, the demographic groups most similar to Blackfeet are Comanche ($88,556, a difference of 0.18%), British West Indian ($88,987, a difference of 0.30%), Bangladeshi ($88,358, a difference of 0.41%), Indonesian ($88,301, a difference of 0.47%), and Guatemalan ($88,295, a difference of 0.48%).
| Demographics | Rating | Rank | Median Family Income |
| Spanish Americans | 0.2 /100 | #274 | Tragic $90,322 |
| Immigrants | St. Vincent and the Grenadines | 0.2 /100 | #275 | Tragic $90,094 |
| Immigrants | Zaire | 0.1 /100 | #276 | Tragic $89,285 |
| Immigrants | Jamaica | 0.1 /100 | #277 | Tragic $89,268 |
| Immigrants | Grenada | 0.1 /100 | #278 | Tragic $89,249 |
| Immigrants | Belize | 0.1 /100 | #279 | Tragic $89,197 |
| British West Indians | 0.1 /100 | #280 | Tragic $88,987 |
| Blackfeet | 0.1 /100 | #281 | Tragic $88,717 |
| Comanche | 0.1 /100 | #282 | Tragic $88,556 |
| Bangladeshis | 0.1 /100 | #283 | Tragic $88,358 |
| Indonesians | 0.1 /100 | #284 | Tragic $88,301 |
| Guatemalans | 0.1 /100 | #285 | Tragic $88,295 |
| Immigrants | Nicaragua | 0.1 /100 | #286 | Tragic $88,267 |
| Potawatomi | 0.1 /100 | #287 | Tragic $88,265 |
| Cherokee | 0.1 /100 | #288 | Tragic $88,209 |