Central American vs Blackfeet Median Family Income
COMPARE
Central American
Blackfeet
Median Family Income
Median Family Income Comparison
Central Americans
Blackfeet
$91,087
MEDIAN FAMILY INCOME
0.3/ 100
METRIC RATING
266th/ 347
METRIC RANK
$88,717
MEDIAN FAMILY INCOME
0.1/ 100
METRIC RATING
281st/ 347
METRIC RANK
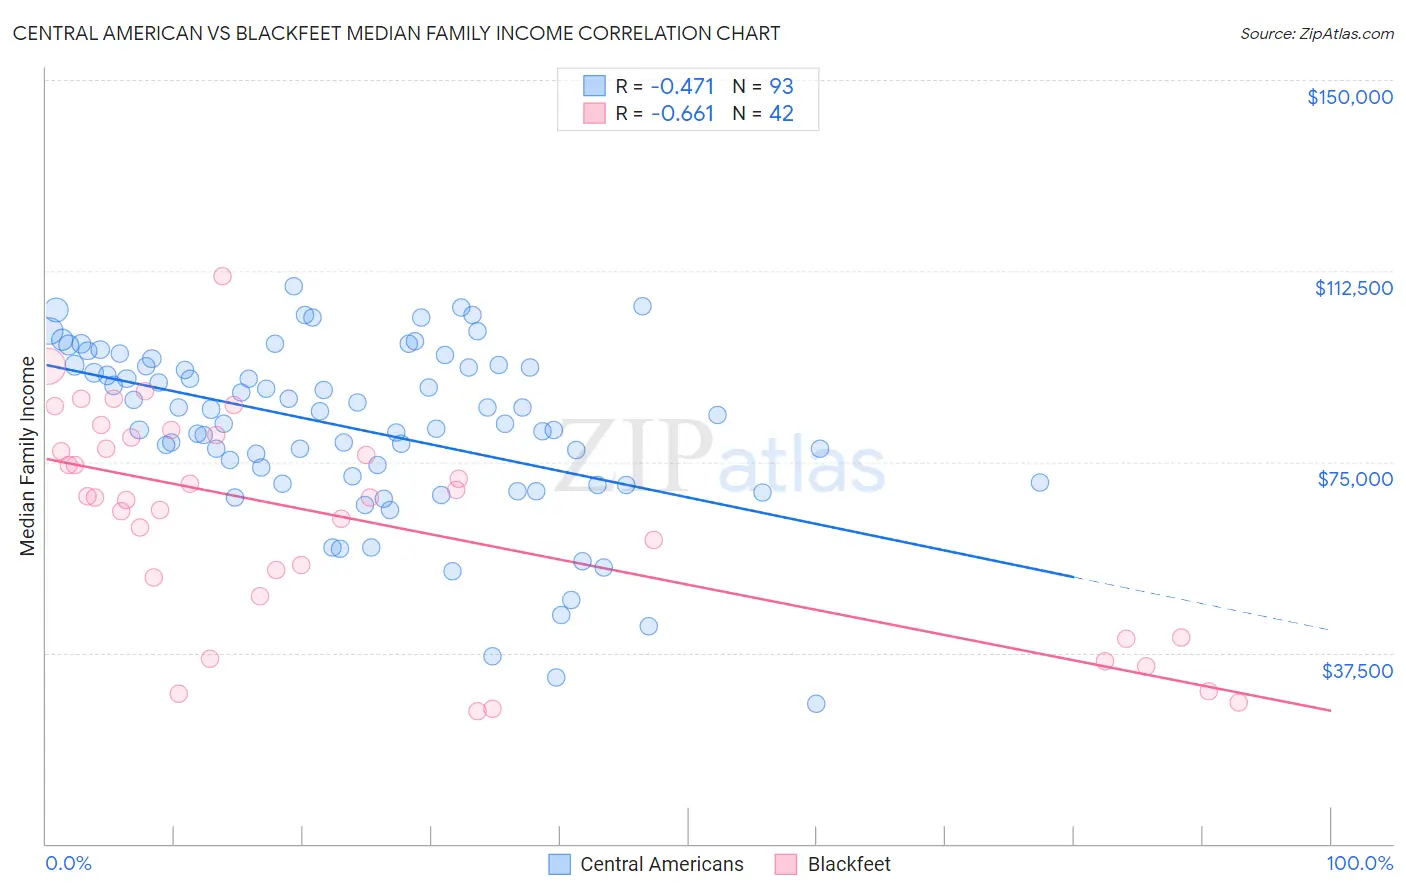
Central American vs Blackfeet Median Family Income Correlation Chart
The statistical analysis conducted on geographies consisting of 503,776,524 people shows a moderate negative correlation between the proportion of Central Americans and median family income in the United States with a correlation coefficient (R) of -0.471 and weighted average of $91,087. Similarly, the statistical analysis conducted on geographies consisting of 309,409,082 people shows a significant negative correlation between the proportion of Blackfeet and median family income in the United States with a correlation coefficient (R) of -0.661 and weighted average of $88,717, a difference of 2.7%.
Median Family Income Correlation Summary
| Measurement | Central American | Blackfeet |
| Minimum | $27,406 | $26,000 |
| Maximum | $109,579 | $111,536 |
| Range | $82,173 | $85,536 |
| Mean | $81,381 | $63,847 |
| Median | $84,167 | $68,073 |
| Interquartile 25% (IQ1) | $70,836 | $48,694 |
| Interquartile 75% (IQ3) | $93,875 | $79,668 |
| Interquartile Range (IQR) | $23,039 | $30,974 |
| Standard Deviation (Sample) | $17,262 | $21,241 |
| Standard Deviation (Population) | $17,169 | $20,987 |
Demographics Similar to Central Americans and Blackfeet by Median Family Income
In terms of median family income, the demographic groups most similar to Central Americans are Mexican American Indian ($90,918, a difference of 0.19%), Hmong ($91,296, a difference of 0.23%), Cree ($90,882, a difference of 0.23%), Belizean ($90,880, a difference of 0.23%), and Senegalese ($91,475, a difference of 0.43%). Similarly, the demographic groups most similar to Blackfeet are Comanche ($88,556, a difference of 0.18%), British West Indian ($88,987, a difference of 0.30%), Bangladeshi ($88,358, a difference of 0.41%), Immigrants from Belize ($89,197, a difference of 0.54%), and Immigrants from Grenada ($89,249, a difference of 0.60%).
| Demographics | Rating | Rank | Median Family Income |
| Immigrants | West Indies | 0.3 /100 | #263 | Tragic $91,588 |
| Senegalese | 0.3 /100 | #264 | Tragic $91,475 |
| Hmong | 0.3 /100 | #265 | Tragic $91,296 |
| Central Americans | 0.3 /100 | #266 | Tragic $91,087 |
| Mexican American Indians | 0.2 /100 | #267 | Tragic $90,918 |
| Cree | 0.2 /100 | #268 | Tragic $90,882 |
| Belizeans | 0.2 /100 | #269 | Tragic $90,880 |
| Jamaicans | 0.2 /100 | #270 | Tragic $90,581 |
| Iroquois | 0.2 /100 | #271 | Tragic $90,543 |
| Immigrants | Liberia | 0.2 /100 | #272 | Tragic $90,450 |
| Immigrants | Micronesia | 0.2 /100 | #273 | Tragic $90,345 |
| Spanish Americans | 0.2 /100 | #274 | Tragic $90,322 |
| Immigrants | St. Vincent and the Grenadines | 0.2 /100 | #275 | Tragic $90,094 |
| Immigrants | Zaire | 0.1 /100 | #276 | Tragic $89,285 |
| Immigrants | Jamaica | 0.1 /100 | #277 | Tragic $89,268 |
| Immigrants | Grenada | 0.1 /100 | #278 | Tragic $89,249 |
| Immigrants | Belize | 0.1 /100 | #279 | Tragic $89,197 |
| British West Indians | 0.1 /100 | #280 | Tragic $88,987 |
| Blackfeet | 0.1 /100 | #281 | Tragic $88,717 |
| Comanche | 0.1 /100 | #282 | Tragic $88,556 |
| Bangladeshis | 0.1 /100 | #283 | Tragic $88,358 |