Lumbee vs Navajo Median Family Income
COMPARE
Lumbee
Navajo
Median Family Income
Median Family Income Comparison
Lumbee
Navajo
$68,679
MEDIAN FAMILY INCOME
0.0/ 100
METRIC RATING
347th/ 347
METRIC RANK
$70,989
MEDIAN FAMILY INCOME
0.0/ 100
METRIC RATING
345th/ 347
METRIC RANK
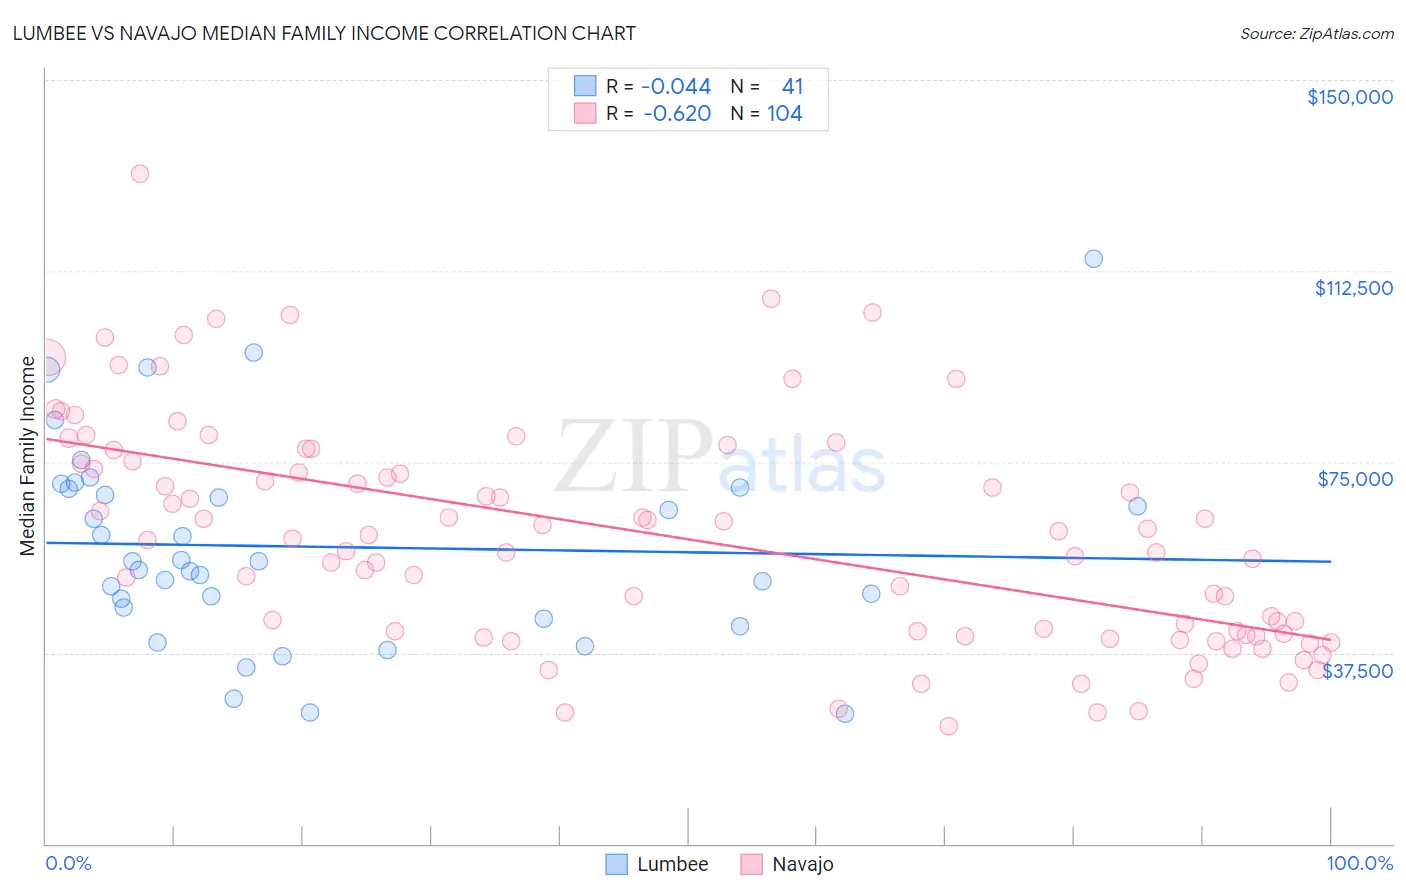
Lumbee vs Navajo Median Family Income Correlation Chart
The statistical analysis conducted on geographies consisting of 92,247,043 people shows no correlation between the proportion of Lumbee and median family income in the United States with a correlation coefficient (R) of -0.044 and weighted average of $68,679. Similarly, the statistical analysis conducted on geographies consisting of 224,690,436 people shows a significant negative correlation between the proportion of Navajo and median family income in the United States with a correlation coefficient (R) of -0.620 and weighted average of $70,989, a difference of 3.4%.
Median Family Income Correlation Summary
| Measurement | Lumbee | Navajo |
| Minimum | $25,481 | $22,955 |
| Maximum | $114,792 | $131,574 |
| Range | $89,311 | $108,619 |
| Mean | $58,324 | $60,376 |
| Median | $55,406 | $59,766 |
| Interquartile 25% (IQ1) | $45,288 | $41,038 |
| Interquartile 75% (IQ3) | $69,902 | $74,887 |
| Interquartile Range (IQR) | $24,614 | $33,849 |
| Standard Deviation (Sample) | $19,662 | $22,079 |
| Standard Deviation (Population) | $19,420 | $21,972 |
Demographics Similar to Lumbee and Navajo by Median Family Income
In terms of median family income, the demographic groups most similar to Lumbee are Puerto Rican ($70,423, a difference of 2.5%), Tohono O'odham ($72,193, a difference of 5.1%), Houma ($76,188, a difference of 10.9%), Crow ($76,605, a difference of 11.5%), and Pueblo ($76,880, a difference of 11.9%). Similarly, the demographic groups most similar to Navajo are Puerto Rican ($70,423, a difference of 0.80%), Tohono O'odham ($72,193, a difference of 1.7%), Houma ($76,188, a difference of 7.3%), Crow ($76,605, a difference of 7.9%), and Pueblo ($76,880, a difference of 8.3%).
| Demographics | Rating | Rank | Median Family Income |
| Blacks/African Americans | 0.0 /100 | #328 | Tragic $81,912 |
| Dutch West Indians | 0.0 /100 | #329 | Tragic $81,852 |
| Cheyenne | 0.0 /100 | #330 | Tragic $81,385 |
| Immigrants | Dominican Republic | 0.0 /100 | #331 | Tragic $81,233 |
| Natives/Alaskans | 0.0 /100 | #332 | Tragic $80,908 |
| Kiowa | 0.0 /100 | #333 | Tragic $80,885 |
| Menominee | 0.0 /100 | #334 | Tragic $79,563 |
| Yup'ik | 0.0 /100 | #335 | Tragic $79,290 |
| Immigrants | Cuba | 0.0 /100 | #336 | Tragic $78,249 |
| Yuman | 0.0 /100 | #337 | Tragic $78,055 |
| Immigrants | Yemen | 0.0 /100 | #338 | Tragic $77,457 |
| Pima | 0.0 /100 | #339 | Tragic $77,431 |
| Hopi | 0.0 /100 | #340 | Tragic $77,188 |
| Pueblo | 0.0 /100 | #341 | Tragic $76,880 |
| Crow | 0.0 /100 | #342 | Tragic $76,605 |
| Houma | 0.0 /100 | #343 | Tragic $76,188 |
| Tohono O'odham | 0.0 /100 | #344 | Tragic $72,193 |
| Navajo | 0.0 /100 | #345 | Tragic $70,989 |
| Puerto Ricans | 0.0 /100 | #346 | Tragic $70,423 |
| Lumbee | 0.0 /100 | #347 | Tragic $68,679 |