Lumbee vs Cheyenne Median Family Income
COMPARE
Lumbee
Cheyenne
Median Family Income
Median Family Income Comparison
Lumbee
Cheyenne
$68,679
MEDIAN FAMILY INCOME
0.0/ 100
METRIC RATING
347th/ 347
METRIC RANK
$81,385
MEDIAN FAMILY INCOME
0.0/ 100
METRIC RATING
330th/ 347
METRIC RANK
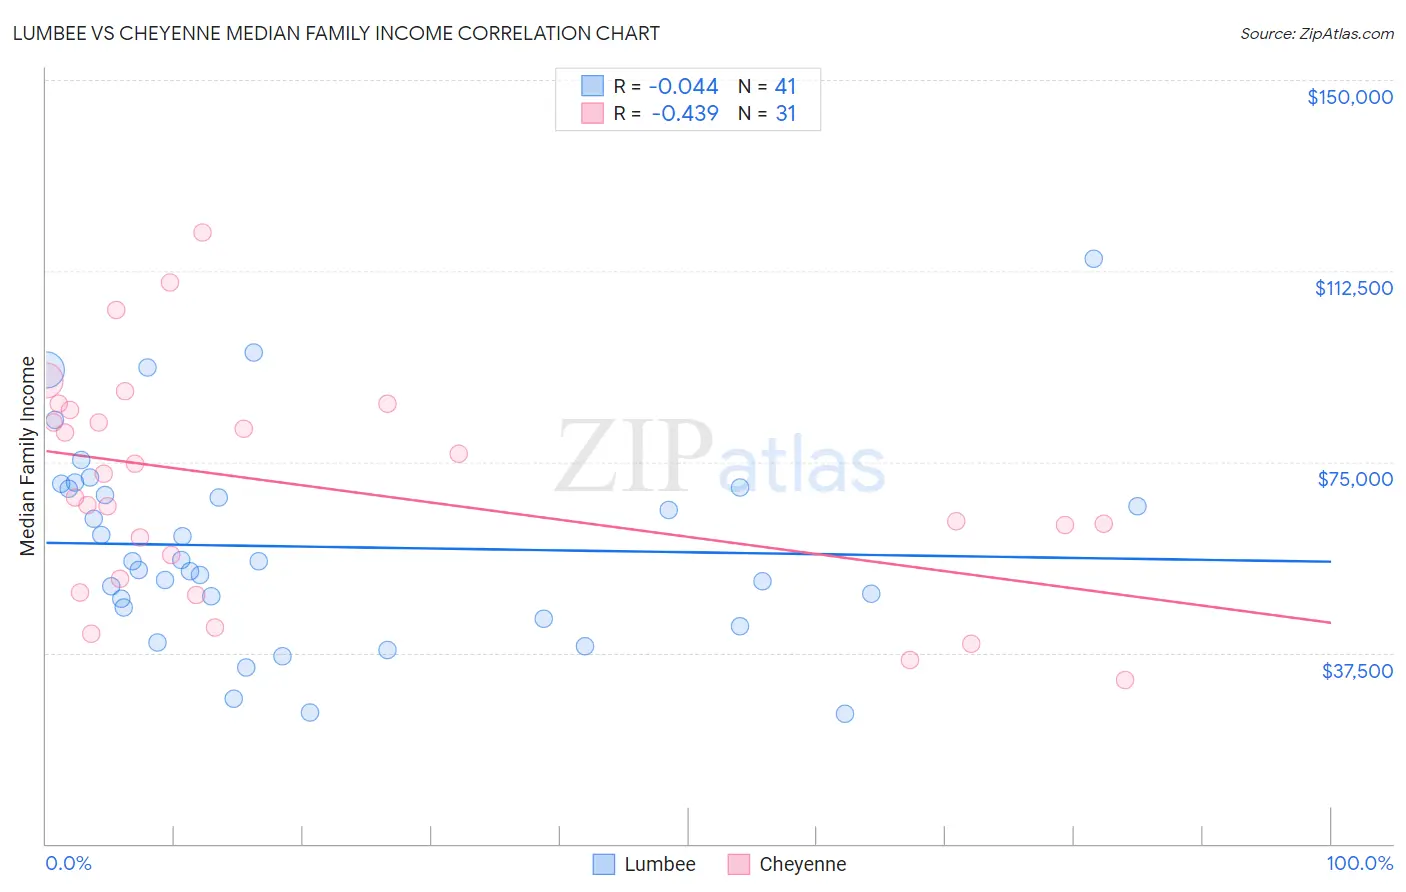
Lumbee vs Cheyenne Median Family Income Correlation Chart
The statistical analysis conducted on geographies consisting of 92,247,043 people shows no correlation between the proportion of Lumbee and median family income in the United States with a correlation coefficient (R) of -0.044 and weighted average of $68,679. Similarly, the statistical analysis conducted on geographies consisting of 80,698,521 people shows a moderate negative correlation between the proportion of Cheyenne and median family income in the United States with a correlation coefficient (R) of -0.439 and weighted average of $81,385, a difference of 18.5%.
Median Family Income Correlation Summary
| Measurement | Lumbee | Cheyenne |
| Minimum | $25,481 | $32,159 |
| Maximum | $114,792 | $120,128 |
| Range | $89,311 | $87,969 |
| Mean | $58,324 | $70,077 |
| Median | $55,406 | $67,927 |
| Interquartile 25% (IQ1) | $45,288 | $52,031 |
| Interquartile 75% (IQ3) | $69,902 | $85,161 |
| Interquartile Range (IQR) | $24,614 | $33,130 |
| Standard Deviation (Sample) | $19,662 | $21,843 |
| Standard Deviation (Population) | $19,420 | $21,488 |
Demographics Similar to Lumbee and Cheyenne by Median Family Income
In terms of median family income, the demographic groups most similar to Lumbee are Puerto Rican ($70,423, a difference of 2.5%), Navajo ($70,989, a difference of 3.4%), Tohono O'odham ($72,193, a difference of 5.1%), Houma ($76,188, a difference of 10.9%), and Crow ($76,605, a difference of 11.5%). Similarly, the demographic groups most similar to Cheyenne are Immigrants from Dominican Republic ($81,233, a difference of 0.19%), Dutch West Indian ($81,852, a difference of 0.57%), Native/Alaskan ($80,908, a difference of 0.59%), Kiowa ($80,885, a difference of 0.62%), and Black/African American ($81,912, a difference of 0.65%).
| Demographics | Rating | Rank | Median Family Income |
| Blacks/African Americans | 0.0 /100 | #328 | Tragic $81,912 |
| Dutch West Indians | 0.0 /100 | #329 | Tragic $81,852 |
| Cheyenne | 0.0 /100 | #330 | Tragic $81,385 |
| Immigrants | Dominican Republic | 0.0 /100 | #331 | Tragic $81,233 |
| Natives/Alaskans | 0.0 /100 | #332 | Tragic $80,908 |
| Kiowa | 0.0 /100 | #333 | Tragic $80,885 |
| Menominee | 0.0 /100 | #334 | Tragic $79,563 |
| Yup'ik | 0.0 /100 | #335 | Tragic $79,290 |
| Immigrants | Cuba | 0.0 /100 | #336 | Tragic $78,249 |
| Yuman | 0.0 /100 | #337 | Tragic $78,055 |
| Immigrants | Yemen | 0.0 /100 | #338 | Tragic $77,457 |
| Pima | 0.0 /100 | #339 | Tragic $77,431 |
| Hopi | 0.0 /100 | #340 | Tragic $77,188 |
| Pueblo | 0.0 /100 | #341 | Tragic $76,880 |
| Crow | 0.0 /100 | #342 | Tragic $76,605 |
| Houma | 0.0 /100 | #343 | Tragic $76,188 |
| Tohono O'odham | 0.0 /100 | #344 | Tragic $72,193 |
| Navajo | 0.0 /100 | #345 | Tragic $70,989 |
| Puerto Ricans | 0.0 /100 | #346 | Tragic $70,423 |
| Lumbee | 0.0 /100 | #347 | Tragic $68,679 |