Immigrants from England vs Blackfeet Median Family Income
COMPARE
Immigrants from England
Blackfeet
Median Family Income
Median Family Income Comparison
Immigrants from England
Blackfeet
$112,038
MEDIAN FAMILY INCOME
99.2/ 100
METRIC RATING
82nd/ 347
METRIC RANK
$88,717
MEDIAN FAMILY INCOME
0.1/ 100
METRIC RATING
281st/ 347
METRIC RANK
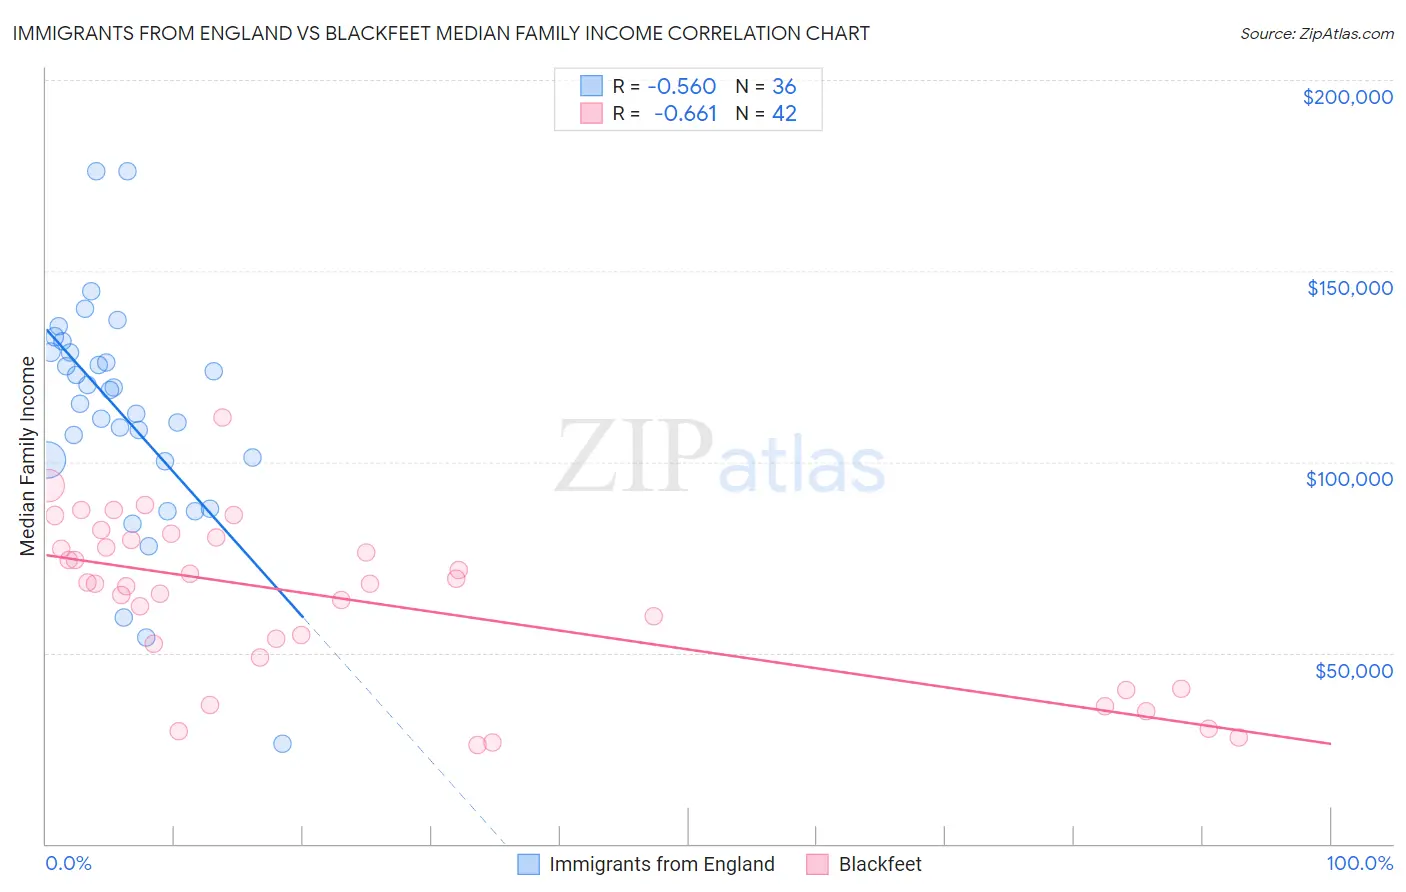
Immigrants from England vs Blackfeet Median Family Income Correlation Chart
The statistical analysis conducted on geographies consisting of 391,652,266 people shows a substantial negative correlation between the proportion of Immigrants from England and median family income in the United States with a correlation coefficient (R) of -0.560 and weighted average of $112,038. Similarly, the statistical analysis conducted on geographies consisting of 309,409,082 people shows a significant negative correlation between the proportion of Blackfeet and median family income in the United States with a correlation coefficient (R) of -0.661 and weighted average of $88,717, a difference of 26.3%.
Median Family Income Correlation Summary
| Measurement | Immigrants from England | Blackfeet |
| Minimum | $26,250 | $26,000 |
| Maximum | $176,139 | $111,536 |
| Range | $149,889 | $85,536 |
| Mean | $112,548 | $63,847 |
| Median | $117,120 | $68,073 |
| Interquartile 25% (IQ1) | $100,437 | $48,694 |
| Interquartile 75% (IQ3) | $128,664 | $79,668 |
| Interquartile Range (IQR) | $28,227 | $30,974 |
| Standard Deviation (Sample) | $29,901 | $21,241 |
| Standard Deviation (Population) | $29,483 | $20,987 |
Similar Demographics by Median Family Income
Demographics Similar to Immigrants from England by Median Family Income
In terms of median family income, the demographic groups most similar to Immigrants from England are Immigrants from North America ($112,151, a difference of 0.10%), Immigrants from Croatia ($112,323, a difference of 0.25%), Immigrants from Canada ($112,374, a difference of 0.30%), Italian ($112,372, a difference of 0.30%), and Immigrants from Egypt ($111,689, a difference of 0.31%).
| Demographics | Rating | Rank | Median Family Income |
| Immigrants | Western Europe | 99.4 /100 | #75 | Exceptional $112,688 |
| Argentineans | 99.4 /100 | #76 | Exceptional $112,665 |
| Immigrants | Eastern Europe | 99.4 /100 | #77 | Exceptional $112,527 |
| Immigrants | Canada | 99.3 /100 | #78 | Exceptional $112,374 |
| Italians | 99.3 /100 | #79 | Exceptional $112,372 |
| Immigrants | Croatia | 99.3 /100 | #80 | Exceptional $112,323 |
| Immigrants | North America | 99.2 /100 | #81 | Exceptional $112,151 |
| Immigrants | England | 99.2 /100 | #82 | Exceptional $112,038 |
| Immigrants | Egypt | 99.0 /100 | #83 | Exceptional $111,689 |
| Immigrants | Hungary | 98.8 /100 | #84 | Exceptional $111,378 |
| Croatians | 98.8 /100 | #85 | Exceptional $111,370 |
| Ukrainians | 98.8 /100 | #86 | Exceptional $111,368 |
| Austrians | 98.8 /100 | #87 | Exceptional $111,306 |
| Romanians | 98.8 /100 | #88 | Exceptional $111,243 |
| Immigrants | Argentina | 98.5 /100 | #89 | Exceptional $110,873 |
Demographics Similar to Blackfeet by Median Family Income
In terms of median family income, the demographic groups most similar to Blackfeet are Comanche ($88,556, a difference of 0.18%), British West Indian ($88,987, a difference of 0.30%), Bangladeshi ($88,358, a difference of 0.41%), Indonesian ($88,301, a difference of 0.47%), and Guatemalan ($88,295, a difference of 0.48%).
| Demographics | Rating | Rank | Median Family Income |
| Spanish Americans | 0.2 /100 | #274 | Tragic $90,322 |
| Immigrants | St. Vincent and the Grenadines | 0.2 /100 | #275 | Tragic $90,094 |
| Immigrants | Zaire | 0.1 /100 | #276 | Tragic $89,285 |
| Immigrants | Jamaica | 0.1 /100 | #277 | Tragic $89,268 |
| Immigrants | Grenada | 0.1 /100 | #278 | Tragic $89,249 |
| Immigrants | Belize | 0.1 /100 | #279 | Tragic $89,197 |
| British West Indians | 0.1 /100 | #280 | Tragic $88,987 |
| Blackfeet | 0.1 /100 | #281 | Tragic $88,717 |
| Comanche | 0.1 /100 | #282 | Tragic $88,556 |
| Bangladeshis | 0.1 /100 | #283 | Tragic $88,358 |
| Indonesians | 0.1 /100 | #284 | Tragic $88,301 |
| Guatemalans | 0.1 /100 | #285 | Tragic $88,295 |
| Immigrants | Nicaragua | 0.1 /100 | #286 | Tragic $88,267 |
| Potawatomi | 0.1 /100 | #287 | Tragic $88,265 |
| Cherokee | 0.1 /100 | #288 | Tragic $88,209 |